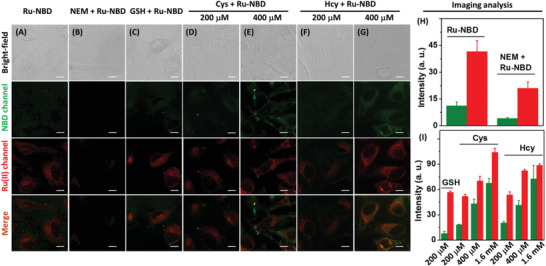
Figure 4.

Luminescence imaging of biothiols in HeLa cells. A) HeLa cells were incubated with Ru‐NBD (50 × 10−6 m) for 5 h. B) HeLa cells were incubated with NEM (100 × 10−6 m) for 2 h before staining with Ru‐NBD (50 × 10−6 m) for another 5 h. C–G) HeLa cells were incubated with GSH (200 × 10−6 m), Cys (200 × 10−6 m), Cys (400 × 10−6 m), Hcy (200 × 10−6 m), Cys (400 × 10−6 m), respectively, followed by the staining with Ru‐NBD (50 × 10−6 m) for another 5 h. Intracellular luminescence intensity at both green and red channels of H) group A and B cells and I) group C‐G and HeLa cells supplied with 1600 × 10−6 m Cys and Hcy, respectively. Scale bar: 10 µm.
