Figure 6.

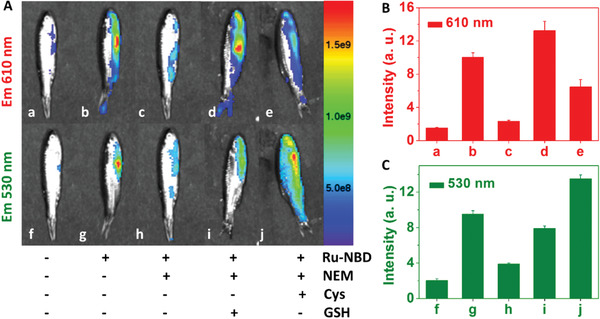
Luminescence imaging of biothiols in adult zebrafish using Ru‐NBD as the probe. A: a,f) Control group; b,g) zebrafish stained with Ru‐NBD (200 × 10−6 m); c, h) zebrafish was treated with NEM (500 × 10−6 m), then incubated with Ru‐NBD (200 × 10−6 m); zebrafish was treated with NEM (500 × 10−6 m), followed by supplying with GSH (500 × 10−6 m) d,i) or Cys (500 × 10−6 m) e, j) before staining with Ru‐NBD (200 × 10−6 m). Mean luminescence intensity of zebrafish at different conditions, red channel (B, E m = 610 nm filter); green channel (C, E m = 530 nm filter).
