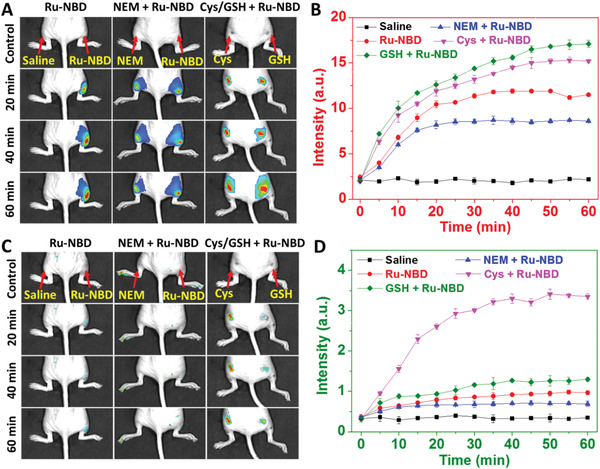
Figure 7.

A,C) Luminescence imaging of biothiols in live mice using Ru‐NBD as a probe. Group 1: 50 µL saline and Ru‐NBD (500 × 10−6 m) were subcutaneously injected into the left and right hind limbs, respectively. Group 2: 50 µL NEM and normal saline were subcutaneously injected into the left and right hind limbs, respectively, followed by the injection of 50 µL Ru‐NBD (500 × 10−6 m) into the both hind limbs. Group 3: 50 µL GSH (500 × 10−6 m) and Cys (500 × 10−6 m) were injected into the left and right legs, respectively, followed by the injection of 50 µL Ru‐NBD (500 × 10−6 m) into the both hind limbs. Time‐dependent enhancement of mean luminescence intensities of images, red channel (B, E m = 610 nm filter); green channel (D, E m = 530 nm filter).
