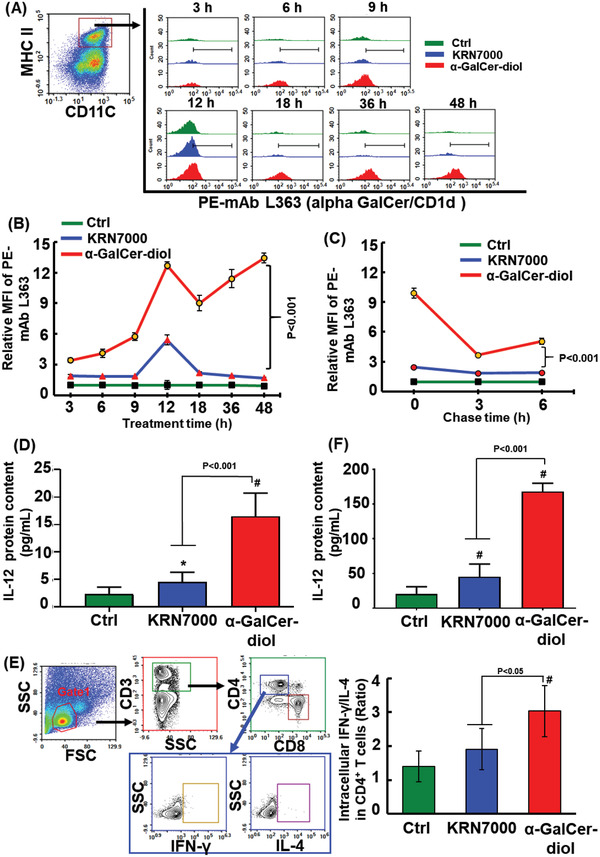
Figure 1.

Enhanced interaction of α‐GalCer‐diol with CD1d. A) BMDCs were incubated with 300 × 10−9 m α‐GalCer‐diol or KRN7000 for different time periods. Thereafter, 2 × 10⁴ CD11c+MHC II+ BMDCs in each sample (the left panel) were gated to assess the MFI of the mCD1d/a‐GalCer complex using mAb L363. Histogram illustrations show L363 staining of cells upon treatment with α‐GalCer‐diol (red) and KRN7000 (blue). B) The MFI of PE‐mAb L363 staining in BMDCs following α‐GalCer‐diol or KRN7000 treatment after 3, 6, 9, 12, 18, 36, and 48 h relative to the untreated control group. C) The relative MFI of L363 staining in BMDCs at each chase time (3 and 6 h) after pretreatment with α‐GalCer‐diol or KRN7000 for 12 h. D) Levels of IL‐12 protein in the supernatants collected from BMDCs (1 × 10⁶/well) treated with 1.26 × 10⁻⁹ m α‐GalCer‐diol or KRN7000 for 24 h. E) Determination of intracellular IFN‐γ and IL‐4 levels in CD4+ T cells. BMDCs were collected after treatment with 1.26 × 10⁻⁹ m α‐GalCer‐diol or KRN7000 for 24 h. Spleen cells were isolated from mice pretreated with 4 nmol α‐GalCer‐diol or KRN7000 for 72 h. Thereafter, spleen cells (1 × 10⁶/well) were coincubated with BMDCs (1 × 10⁵/well) for 6 h, and the levels of intracellular IFN‐γ and IL‐4 in gated lymphocytes (5 × 10⁴ cells, in the red circle, in the left panel) were analyzed by FACS. The ratio of IFN‐γ + to IL‐4+ cells in CD4+ T cells is shown in the right panel. F) IL‐12 protein content in the supernatants was assayed after 48 h of coincubation. Asterisk (*) indicates P < 0.05, and the pound sign (#) denotes P < 0.001, compared to the control group (n = 5).
