
Figure 4.
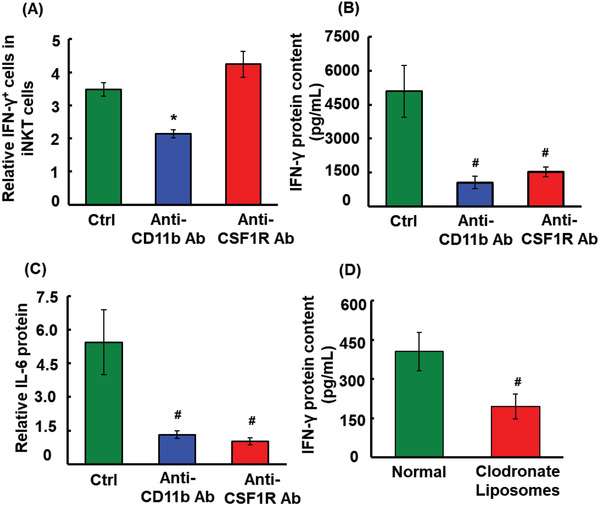
IFN‐γ and IL‐6 production in CD11b+ leukocytes in response to α‐GalCer‐diol treatment. Following intraperitoneally (I.P.) administration of 5 mg kg−1 body weight anti‐CD11b antibody or anti‐CSF‐1R antibody for 24 h, mice were further challenged by 4 nmol α‐GalCer‐diol for another 24 h, followed by serum and spleen collection. A) Quantitative analysis of the percentage of IFN‐γ + iNKT cells in splenocytes from mice following anti‐CD11b antibody or anti‐CSF‐1R antibody treatment relative to the untreated control. B) IFN‐γ protein levels in each group. C) Serum concentrations of IL‐6 in each group. D) Following I.V. administration of 5 mg kg−1 body weight clodronate liposomes for 48 h, mice were further challenged with 4 nmol α‐GalCer‐diol for an additional 24 h, followed by the detection of serum IFN‐γ in each group. Asterisk (*) indicates P < 0.05, and the pound sign (#) denotes P < 0.001, compared to the control group (n = 5).