
Figure 2.
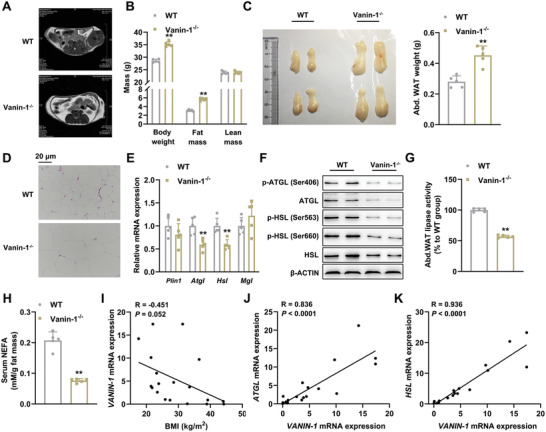
Whole‐body Vanin‐1 deficiency mice exhibit adipocyte hypertrophy and impaired lipolysis. 10‐week‐old WT and Vanin‐1−/− mice were fed with ad libitum. A) Representative micro‐MRI images of 10‐week‐old WT and Vanin‐1−/− mice. B) Body composition analysis. C) Macroscopic appearance and the weight of mouse abdominal WAT. D) Representative images of H&E staining for abdominal WAT sections (original magnification, 400×). Scale bar: 20 µm. E) RT‐qPCR analysis of lipolytic gene expression in the abdominal WAT. F) Western blot analysis of key lipolytic protein expression in the abdominal WAT. G) Total lipase activity in the homogenates of abdominal WAT. H) Serum NEFA levels. ** P < 0.01 versus WT group. n = 5. All values are presented as the mean ± SD. Unpaired Student's t‐test was used for comparison between two groups. I) Correlation of abdominal WAT VANIN‐1 mRNA levels with BMI in obese patients and controls. Correlation of mRNA levels of VANIN‐1 with J) ATGL, K) HSL in the abdominal WAT of human subjects. n = 19. The correlation coefficients (R values) and P values were calculated by Pearson analysis.