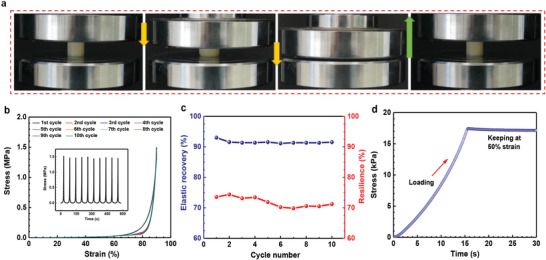
Figure 2.

Mechanical compressibility and elasticity of the hydrogel. a) Photographs of the hydrogel showing high compressibility and elasticity under 90% strain. b) Stress–strain curves of the hydrogel under successive compression cycles and the inset is the corresponding stress–time curves. c) Changes of elastic recovery and resilience as a function of compression cycles for the hydrogel. d) Stress–time curve in a static compression test shows that when the hydrogel was compressed at 50% strain and held for a few seconds, the induced stress could be maintained over time without relaxation.
