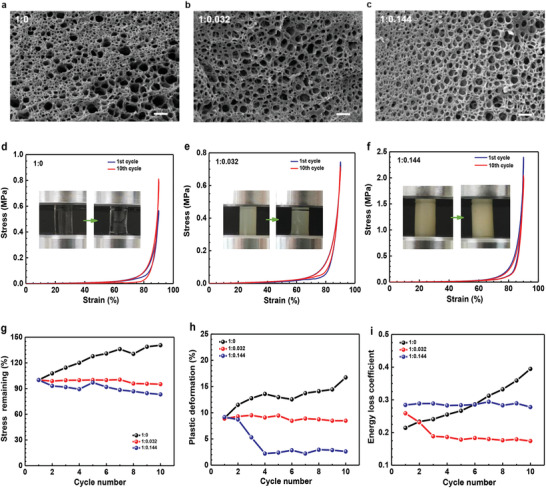
Figure 3.

Morphology and mechanical behavior. a–c) SEM cross section images of three hydrogels with different mass ratios of AAm to SPI. The scale bars: 50 µm. d–f) Stress–strain curves of hydrogels under cyclic compression, the insert photos show the corresponding samples. g–i) Changes of maximum stress, plastic deformation, and energy loss coefficient for hydrogels during the successive compression cycles at 90% strain.
