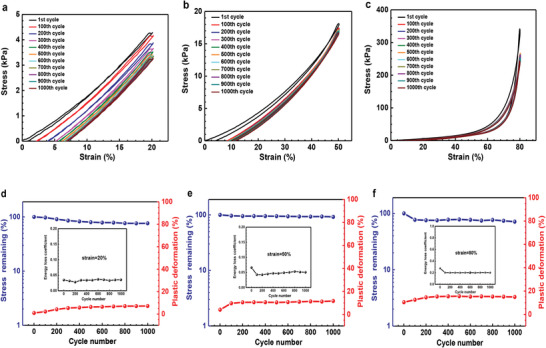
Figure 4.

Fatigue resistance. a–c) Stress–strain curves of hydrogel with a mass ratio of AAm to SPI at 1:0.144, compressed for 1000 cycles at 20% strain, 50% strain, and 80% strain, respectively. d–f) Changes of maximum stress, plastic deformation and energy loss coefficient during 1000 cycles at 20% strain, 50% strain, and 80% strain, respectively.
