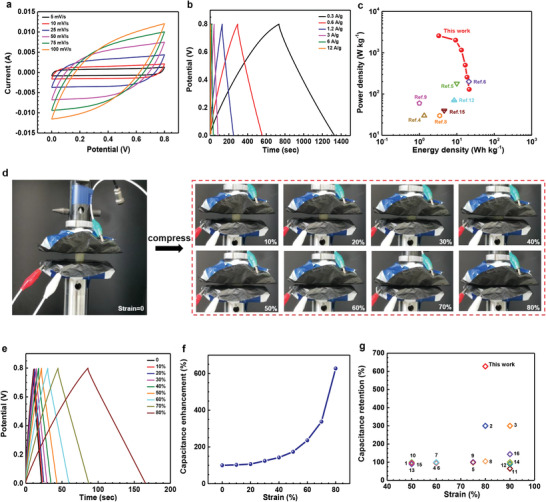
Figure 5.

Electrochemical performance of a hydrogel electrolyte‐based supercapacitor. a) Cyclic voltammetry (CV) curves of the assembled supercapacitor at different scan rates from 5 to 100 mV s−1. b) Galvanostatic charge/discharge (GCD) curves of the assembled supercapacitor at various current densities from 0.3 to 12 A g−1. c) Ragone plot of the assembled supercapacitor device. References in this figure corresponds to the relevant references shown in Table S1, Supporting Information. d) Photographs of the compressible supercapacitor at different strain levels from 0% to 80%. e) GCD curves under different strains from 0% to 80% at a charging/discharging current density of 6 A g−1. f) Capacitance enhancement (%) calculated from GCDs of (e). g) Capacitance retention of the compressible supercapacitor and other previously reported devices. Numbers in this figure corresponds to the relevant references shown in Table S1, Supporting Information.
