Figure 1.

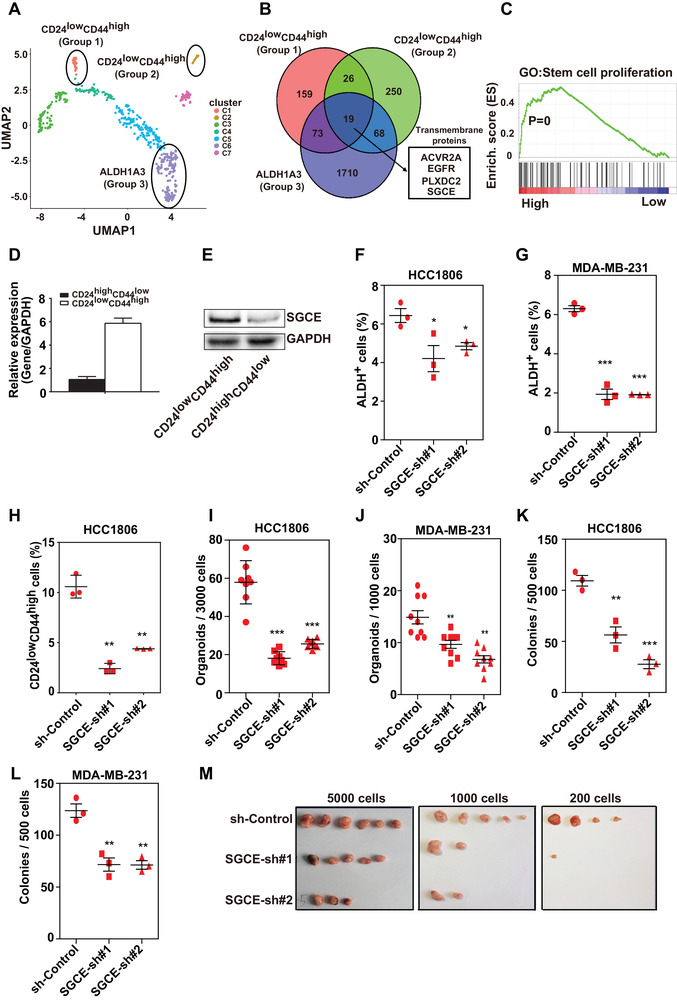
Loss of SGCE inhibits stemness of BCSCs. A) UMAP plot showing distribution of stemness‐related groups of TNBC epithelial cells (groups are separated by expression of CD24, CD44, and ALDH1A3). B) Venn diagram showing intersection of highly expressed genes between each stemness‐related group and nonstemness‐related group. C) GSEA showing enrichment of stem cell proliferation in SGCE differentially expressed genes based on TCGA. D) mRNA and E) protein expression levels of SGCE in BCSC populations. ALDH analysis upon SGCE knockdown in F) HCC1806 and G) MDA‐MB‐231 cells. H) Assay of CD24lowCD44high population upon SGCE knockdown in HCC1806 cells. Tumorsphere assay upon SGCE knockdown in I) HCC1806 and J) MDA‐MB‐231 cells. Clonal formation assay upon SGCE knockdown in K) HCC1806 and L) MDA‐MB‐231 cells. M) Xenograft assay using CD24lowCD44high fraction upon SGCE knockdown in HCC1806 cells.
