
Figure 1.
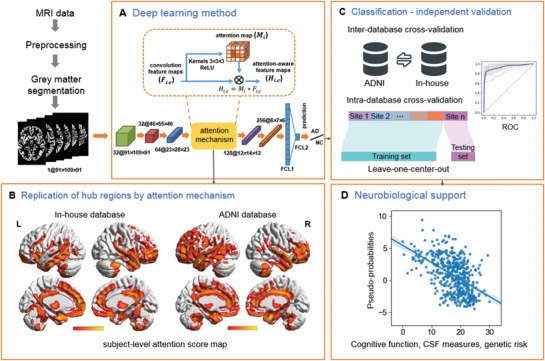
Schematic of the data analysis pipeline. A) The architecture of the 3D attention network (3DAN). In the attention mechanism module, each voxel i of the H × W × D‐dimensional feature maps F i,c was weighted by the H × W × D‐dimensional attention map Mi. The trainable attention map Mi was independent of the channel of the features and was only related to the spatial position. B) The attention score map (left: in‐house database, right: ADNI database) was generated by the attention mechanism module of the 3DAN model, indicating the discriminative power of various brain regions for AD diagnosis. C) To test the robustness and generalizability of the 3DAN model, cross validations were performed using two completely independent databases (an in‐house database and the ADNI database) (Details can be found in Table 1). D) Investigation of the association between the classification output and clinical measures [that is the cognitive function measured by Mini‐Mental State Examination (MMSE), CSF beta‐amyloid (Aβ), CSF tau, and polygenic risk scores (PGRS)] in the AD and MCI groups.