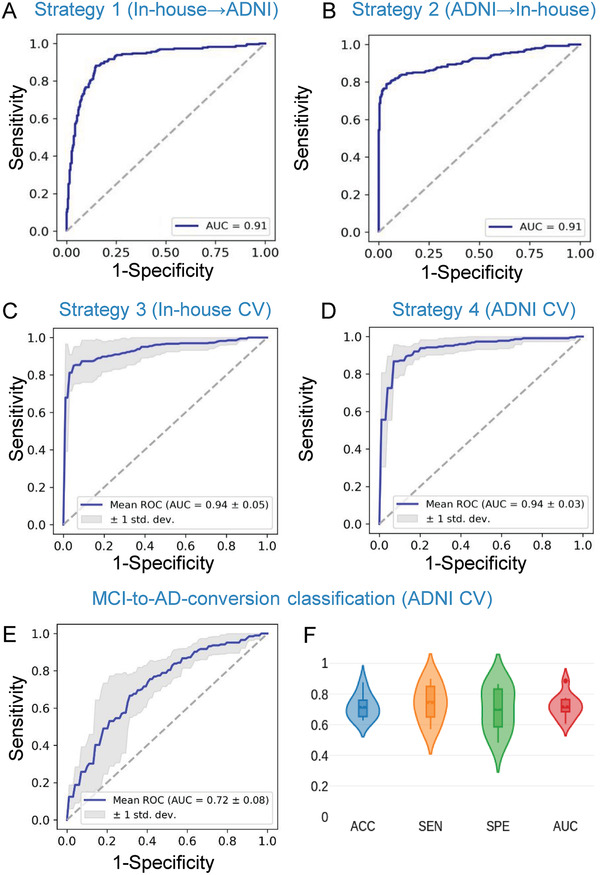
Figure 2.

Diagnostic performance of the ROC curves for AD/NC classification (A–D) and pMCI/sMCI classification (E,F). A) ROC curve for the classifier that was trained on the in‐house database and tested on the ADNI database; B) ROC curve for the classifier that was trained on the ADNI database and tested on the in‐house database; C) ROC curve for the classifier that was trained and tested on the in‐house database with leave‐center‐out cross‐validation (CV); D) ROC curve for the classifier that was trained and tested on the ADNI database with tenfold cross‐validation; E) ROC curve of the pMCI/sMCI classification with tenfold cross‐validation on the ADNI database; F) violin plots for the distributions of the pMCI/sMCI classifications.
