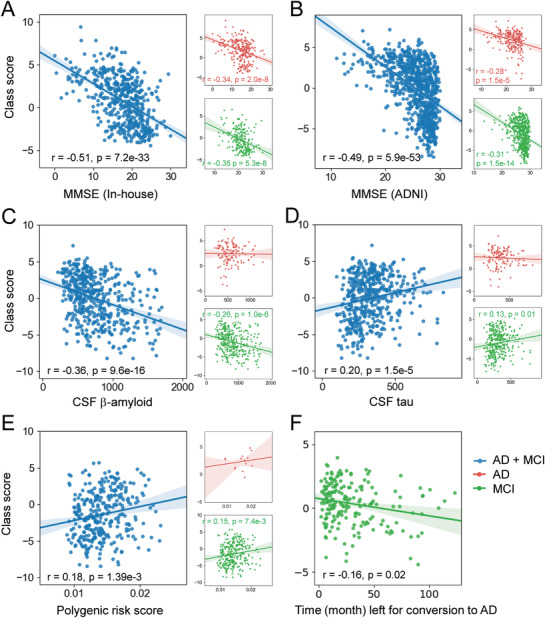
Figure 4.

Correlations between the class scores and the MMSE scores in the in‐house database (A) and the ADNI database (B). Correlations between the class scores and the CSF Aβ (n = 472) (C), CSF tau (n = 472), (D) and polygenetic risk factors (n = 321) (E) of individual subjects in the ADNI database. F) Correlation between the classification output and the length of time before conversion to AD of the pMCI individuals in the ADNI database.
