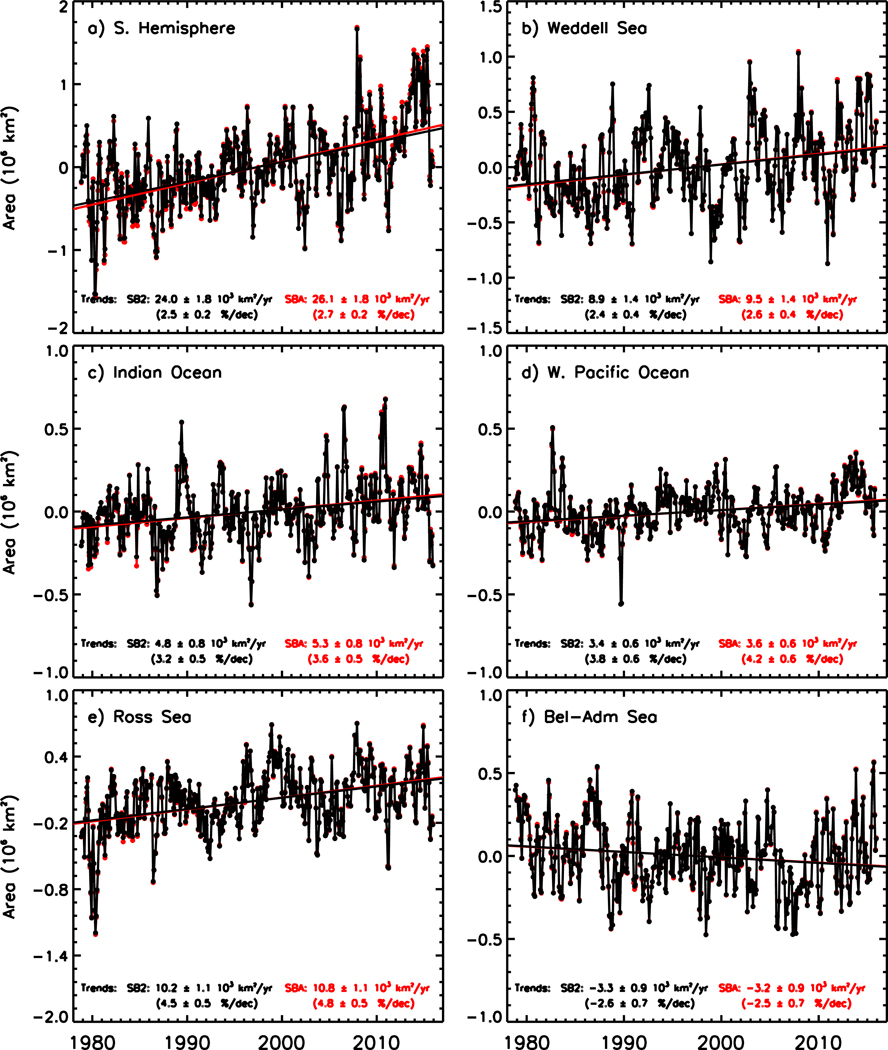
Figure 4.

Plots of the time series of monthly anomalies of sea ice area from 1978 to 2015 and trends in the (a) entire Southern Hemisphere; (b) Weddell Sea; (c) Indian Ocean; (d) West Pacific Ocean; (e) Ross Sea; and (f) Bellingshausen/Amundsen Seas using both SB2 and SBA data.
