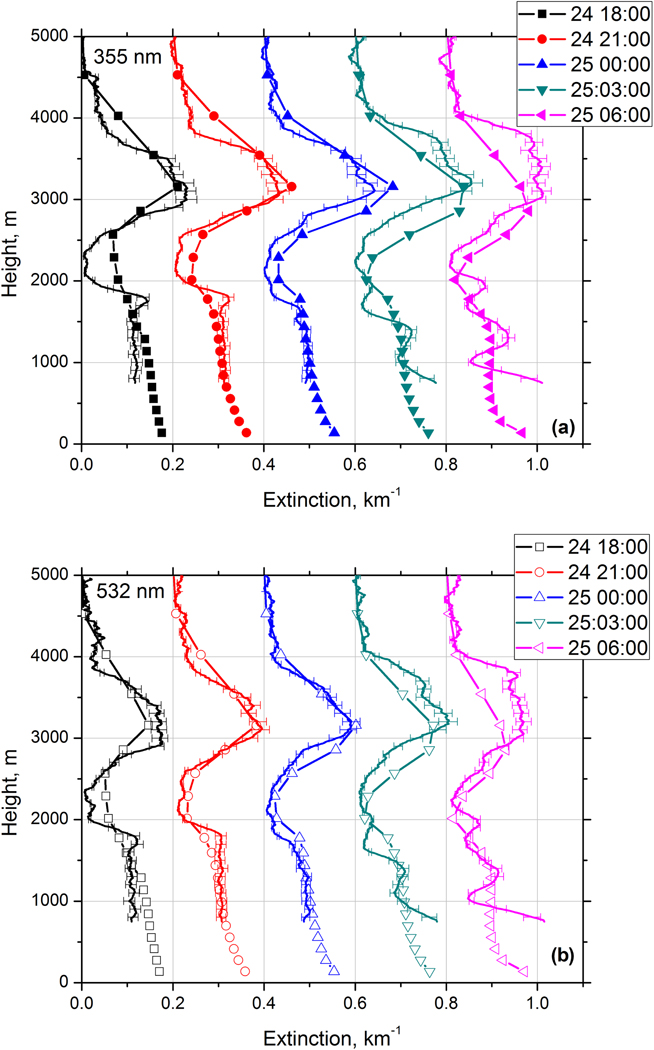
Figure 13.
Comparison of extinction profiles at (a) 355 nm and (b) 532 nm derived from Raman lidar measurements (line) and modeled by MERRA-2 (line + symbols) on the night of 24–25 December 2015. Model profiles are provided at 18:00, 21:00, 00:00, 03:00, and 06:00 UTC. The lidar measurements are given for temporal intervals centered at 19:00, 21:00, 00:00, 03:00, and 06:00 UTC. For each profile, 2 h of measurements are averaged. The profiles are shifted relatively to each other by 0.2 km−1.

