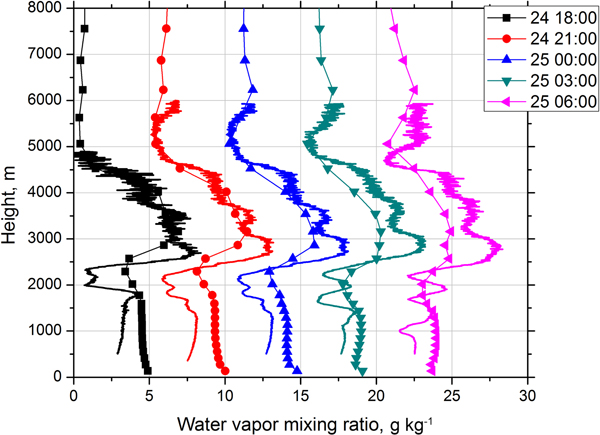
Figure 17.
Water vapor mixing ratio derived from Raman lidar measurements (solid line) and obtained from the model (line + symbols) on the night of 24–25 December 2015. Temporal intervals are the same as in Fig. 13. The profiles are shifted relatively each other by 5 g kg−1.

