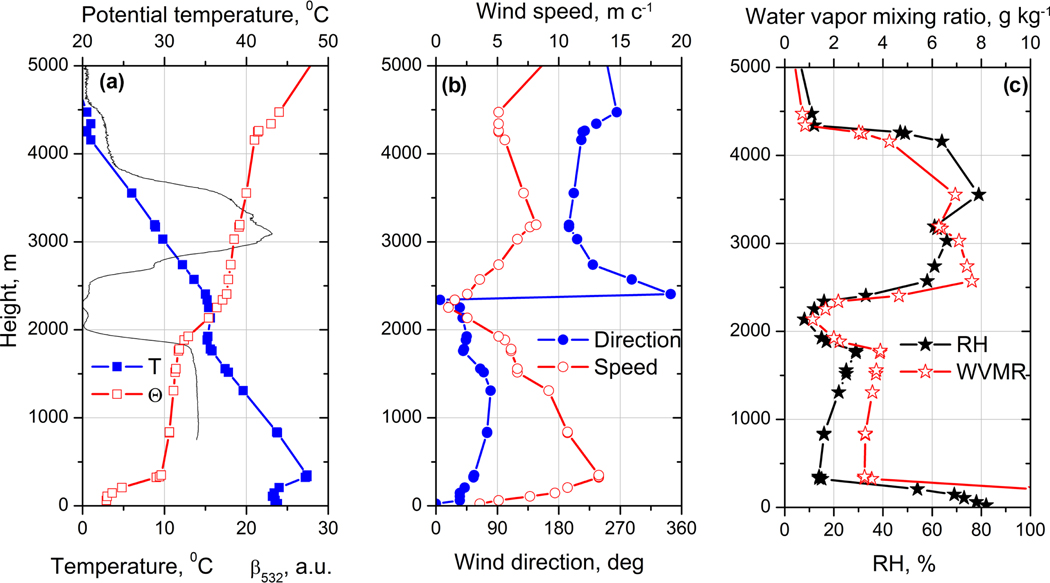
Figure 6.
Vertical profiles of (a) temperature T, potential temperature Θ, (b) wind direction and speed, and (c) relative humidity (RH) and water vapor mixing ratio (WVMR) measured by the radiosonde in Dakar at 00:00 UTC on 25 December 2015. Solid line in plot (a) shows the aerosol backscattering coefficient at 532 nm in arbitrary units measured by the Raman lidar at 21:00 UTC on 24 December.

