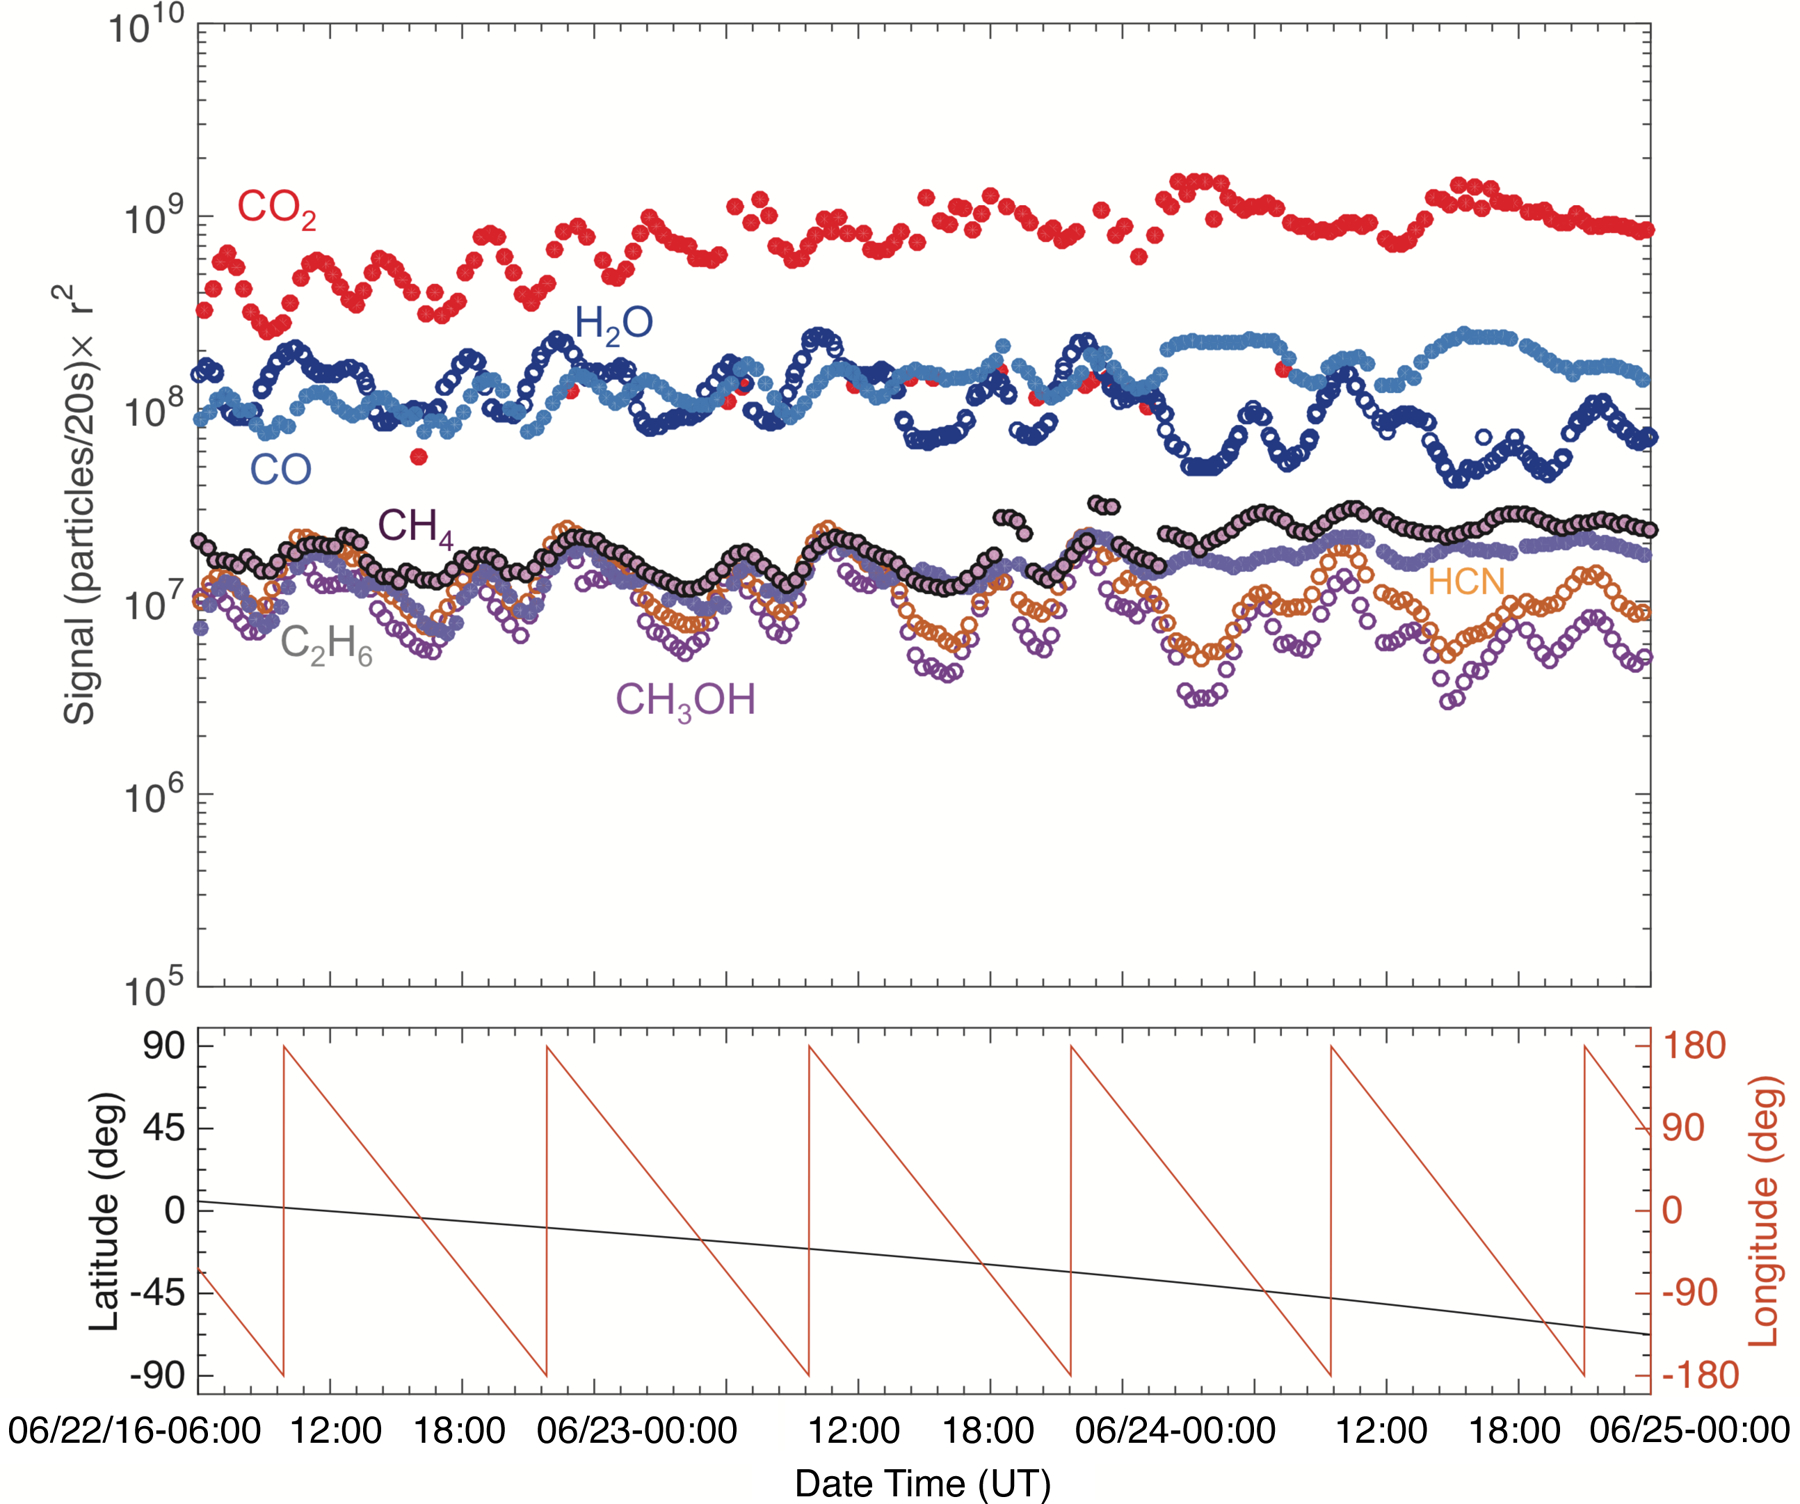
Fig. 2.

Top: post-outbound-equinox (22–24 June 2016) southern hemisphere time variation of the seven studied species scaled to the distance of Rosetta from the center of the nucleus (r2), and the corresponding sub-spacecraft longitude and latitude values (bottom). Species that trend together are illustrated with empty and filled markers. Errors are smaller than the marker size.
