Fig. 4.

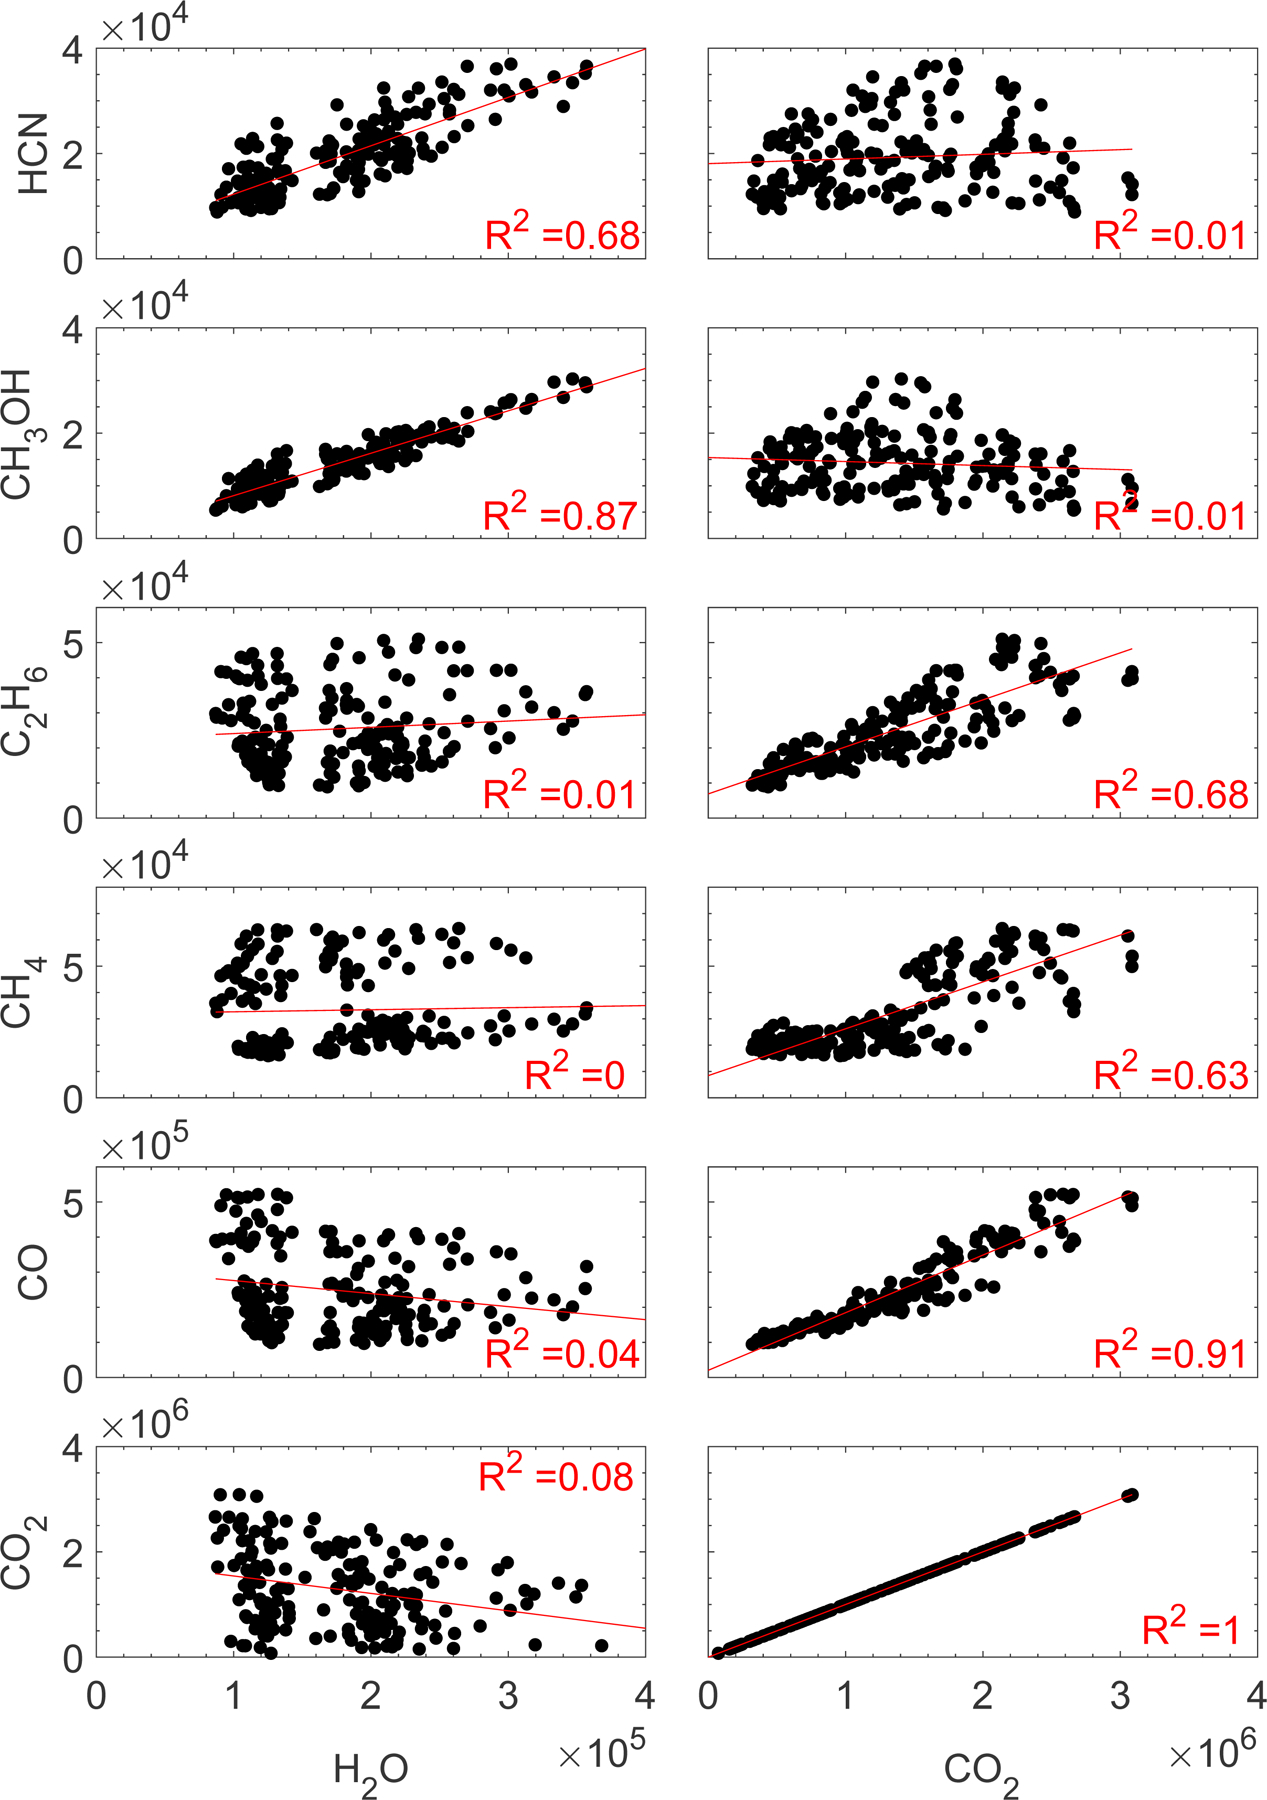
Scatter plots of the seven analyzed minor species against H2O (left) and CO2 (right) for 22–24 June 2016. Data are shown in units of particles/20 s. The linear regression line and the corresponding R2 values for each pair are also shown.

Scatter plots of the seven analyzed minor species against H2O (left) and CO2 (right) for 22–24 June 2016. Data are shown in units of particles/20 s. The linear regression line and the corresponding R2 values for each pair are also shown.