
Fig. 7.
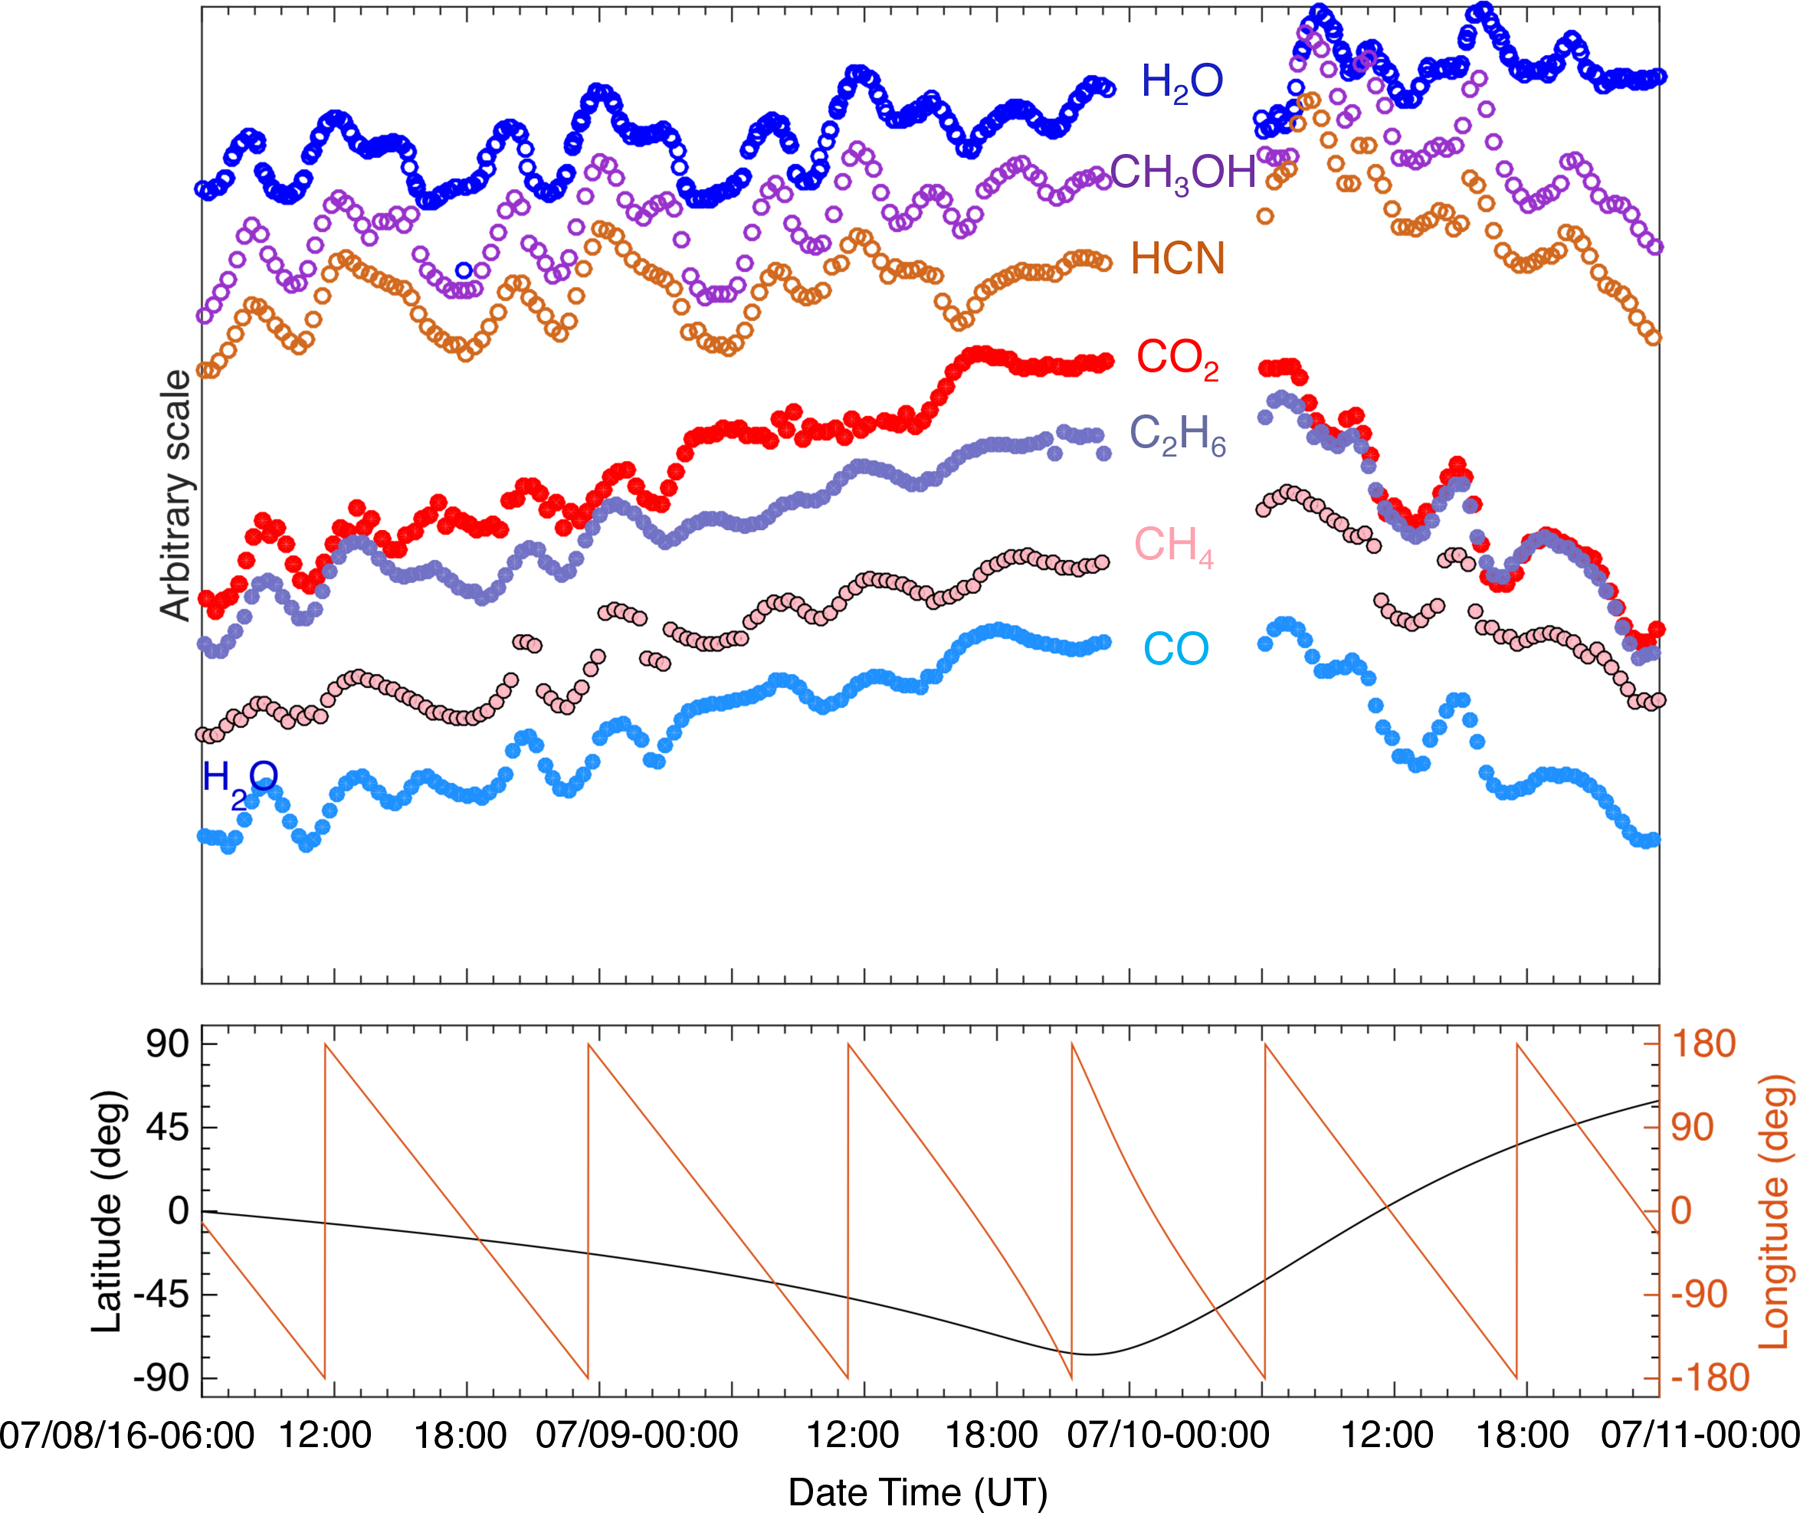
Profiles of major and minor species vs. time, shown on arbitrary scale for 8–10 July 2016. The separation of species into two groups (following H2O or CO2) based on their time variability profiles is clearly visible and is confirmed by the correlations listed in Table 2.