
Fig. 8.
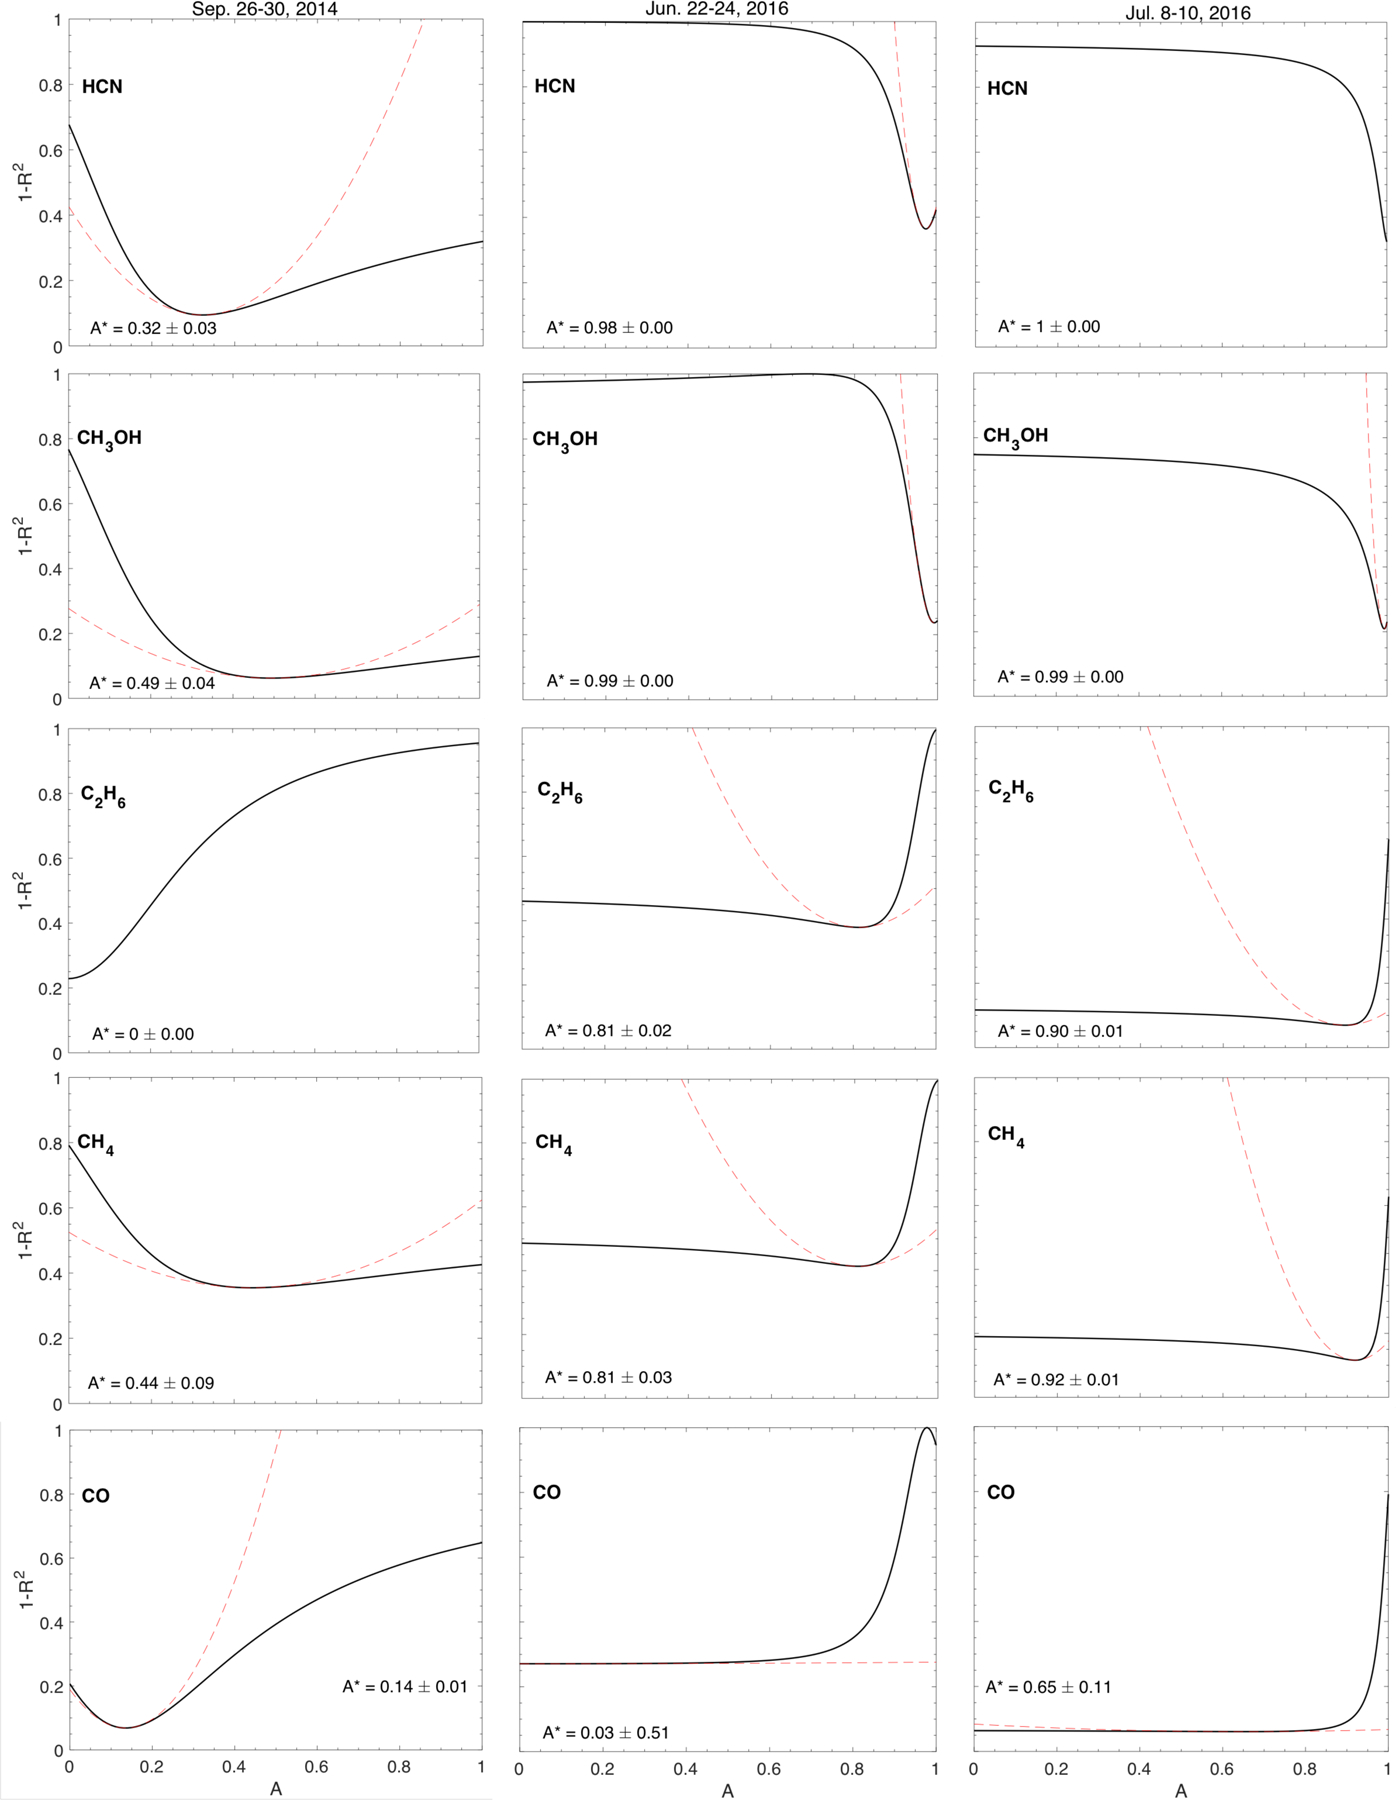
1 − R2 vs. mole fraction (0 = pure CO2, 1 = pure H2O) for three species for the pre-equinox and the two post-equinox time periods. The dashed curves show a parabolic fit to peaks in 1 − R2. These fits provide an indication of the uncertainties in the range of mole fractions that produce the best fit (corresponding to the maximum correlation, i.e., the lowest 1 − R2, see Livadiotis & McComas 2013; Livadiotis 2007). Post-equinox, HCN correlates best with pure H2O. Preand post-equinox, C2H6 correlates best with CO2 because addition of H2O either makes the correlation worse or does not change the correlation. CH4 is clearly different pre- and post-equinox. Pre-equinox, this species correlates better with pure H2O, but post equinox, the correlation is best with pure CO2. HCN pre-equinox is the only species that has a better correlation with a mix of CO2 and H2O.