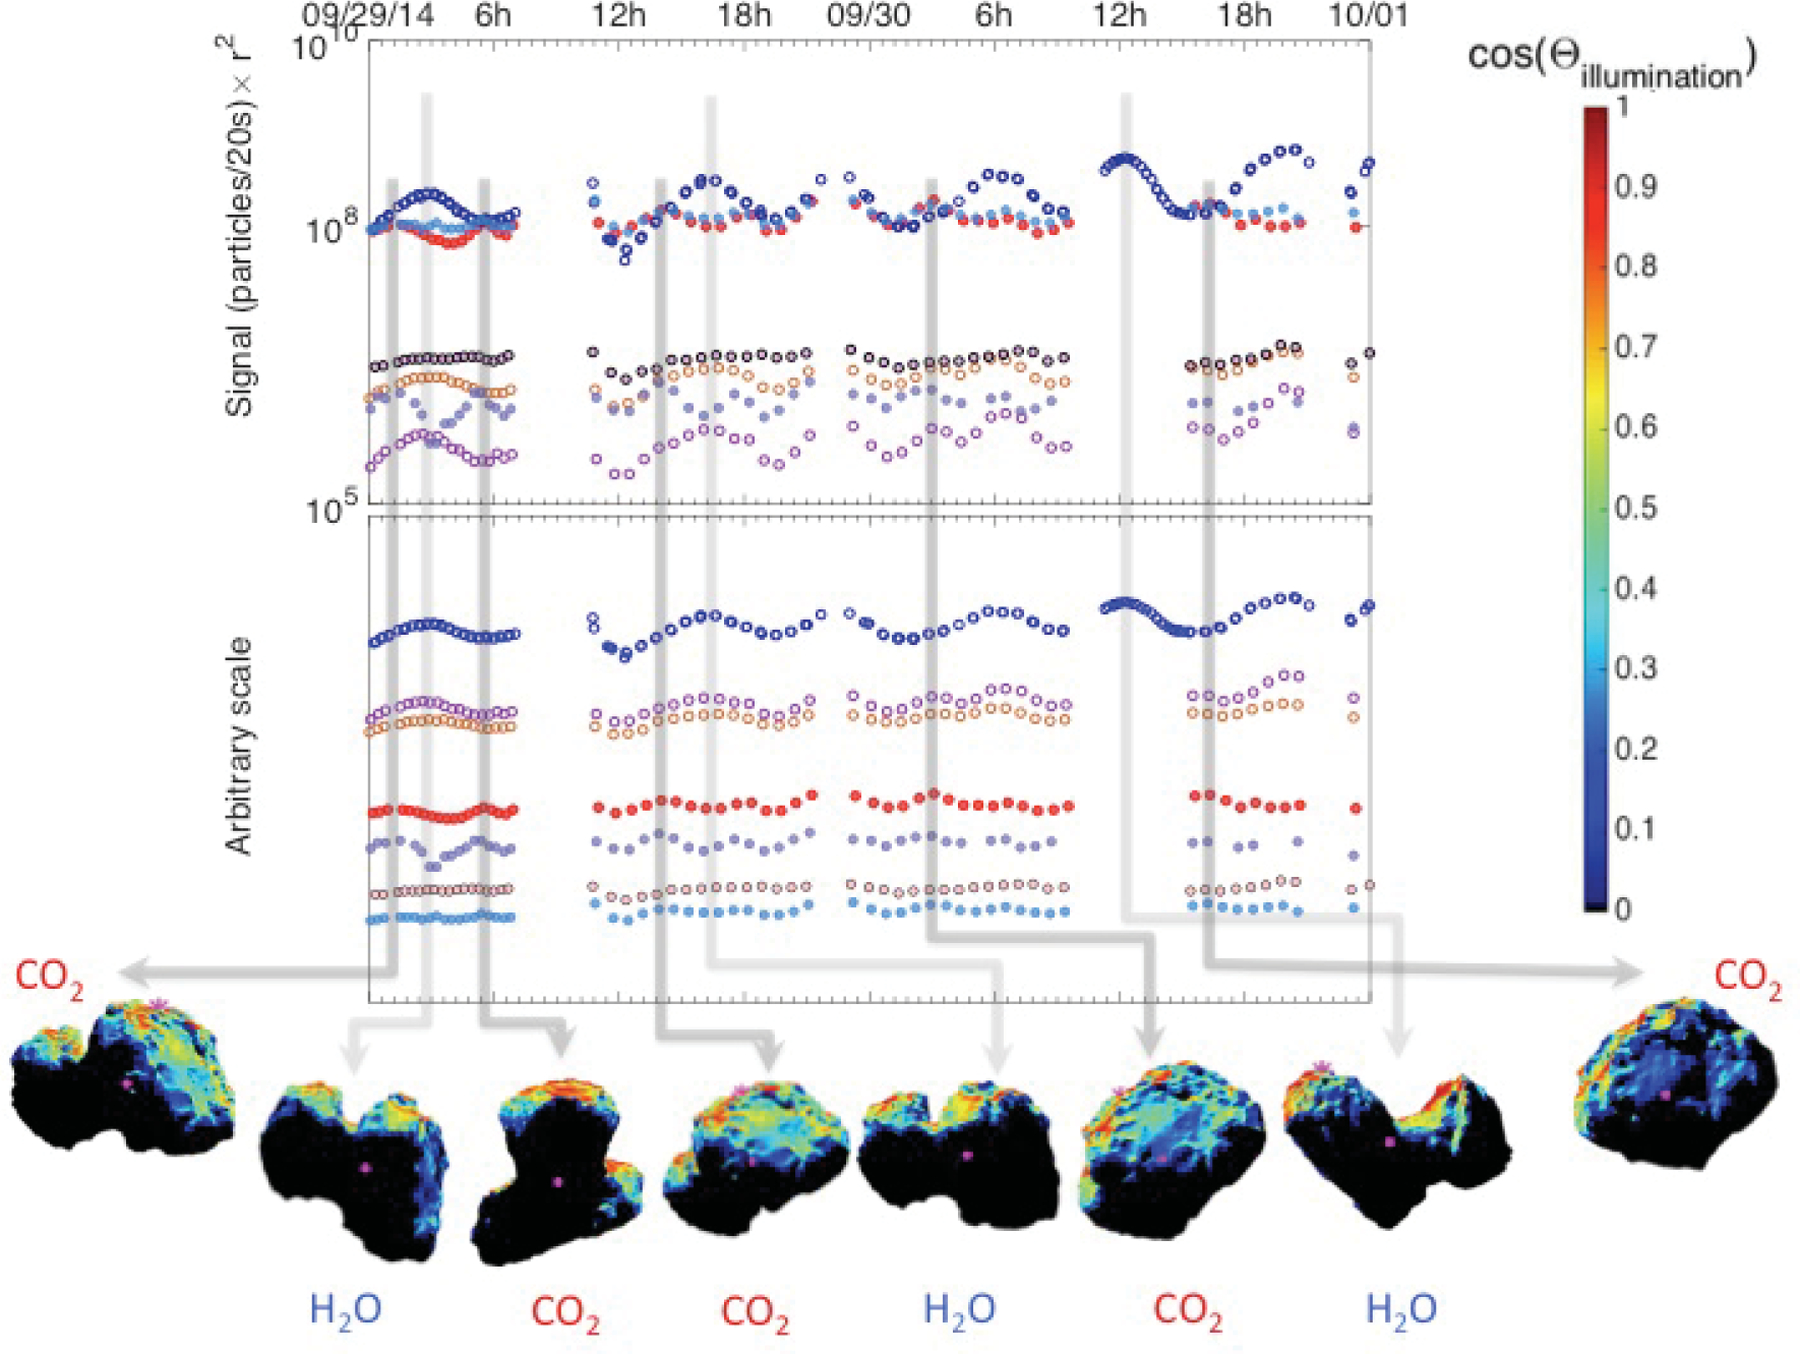
Fig. 9.

Snapshots of the pre-equinox spacecraft view of 67P at the times of signal maxima with the rough illumination (the cosine between the surface normal and the direction of the Sun). Top: signal corrected for r2. Bottom: shifted signal according to volatility. Light gray arrows indicate H2O, while darker gray arrows indicate CO2 maxima. Shape model: ESA NAVCAM.
