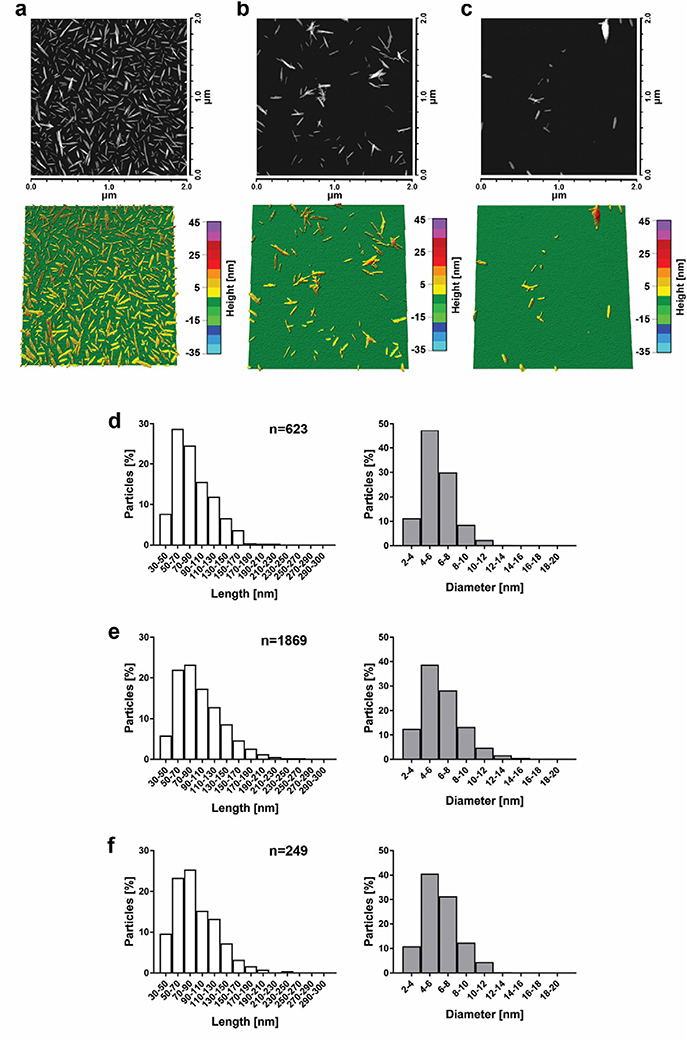
Fig. 1.
Representative AFM images and 3D height maps for unmodified CNC (a), NOTA-CNC-Cy5 (b), and DFO-CNC-Cy5 (c), with corresponding length and diameter distributions derived from the morphometric analysis of >100 individual nanocrystals for unmodified CNC (d), NOTA-CNC-Cy5 (e), and DFO-CNC-Cy5 (f). Columns represent the percentage of particles analyzed falling within the given length and diameter range; n denotes the number of nanocrystals analyzed. A considerably smaller number of nanocrystals could be analyzed for DFO-CNC-Cy5 because of prominent aggregation of the sample upon application on the substrate.

