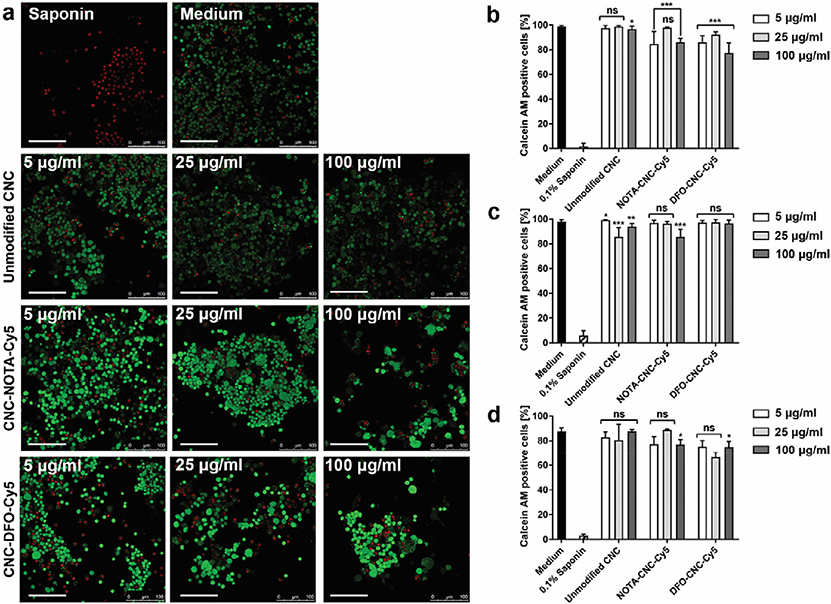
Fig. 2.
a) Representative confocal microscopy images of RAW 264.7 macrophages incubated with different concentrations of unmodified CNC, NOTA-CNC-Cy5, and DFO-CNC-Cy5 for 96 h. Nuclei of dead cells stain red with EthD-1 after loss off cell membrane integrity, while live cells stain green with Calcein AM due to intracellular esterase activity. Medium and 0.1% saponin are used as controls for live and dead cells, respectively. Scale bar 100 μm. Quantification of the proportion of Calcein AM–positive cells at 6 h (b), 24 h (c), and 96 h (d) of incubation with different concentrations of unmodified and modified cellulose nanocrystals. Columns denote mean ± SD of n = 6.5 ± 0.5 (mean ± SEM) analyzed images per time point. Statistical significance of the difference against the positive control was determined by unpaired Mann-Whitney U test with *p < 0.05, **p < 0.01, and ***p < 0.001; ns, not significant.

