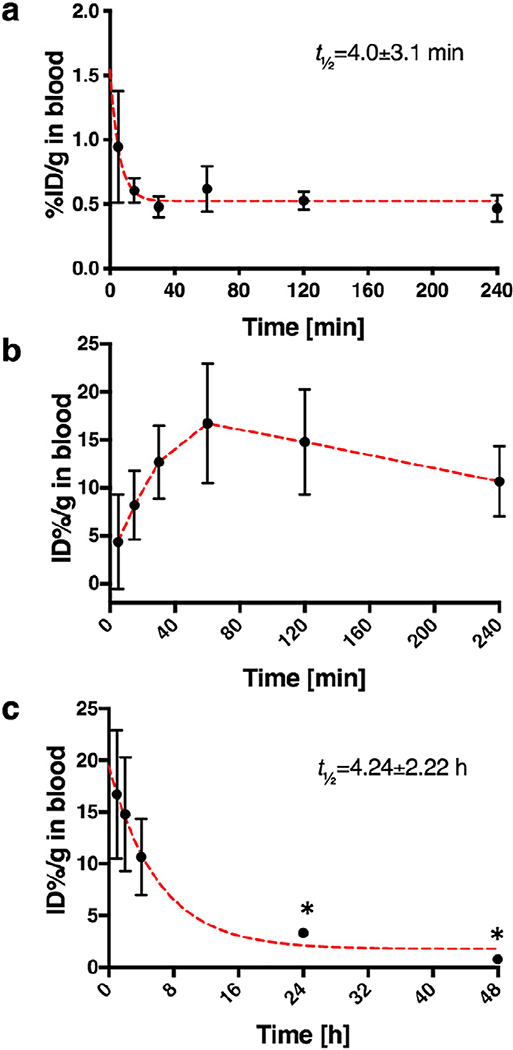
Fig. 4.
a) Blood half-life curve for [64Cu]Cu-NOTA-CNC-Cy5, markers represent mean ± SD of five samples per time point with fitted exponential one-phase decay (red dashed line) to determine the half-life, R2 = 0.3974; b) Early time points in the blood sampling for [89Zr]Zr-CNC-DFO-Cy5 showed the slow release of radioactivity from an unknown reservoir, presumably the lung, to the circulation after 60 min. Markers represent mean ± SD of five samples, the dashed line in red is guide for the eye only. c) In order to determine the blood half-life of [89Zr]Zr-CNC-DFO-Cy5, the data for 60–240 min in b) was supplemented with blood values from the biodistribution study at 24 and 48 h (*; n = 3 per time point, markers represent mean ± SD). Red dashed line shows fitted exponential one-phase decay with R2 = 0.6225.

