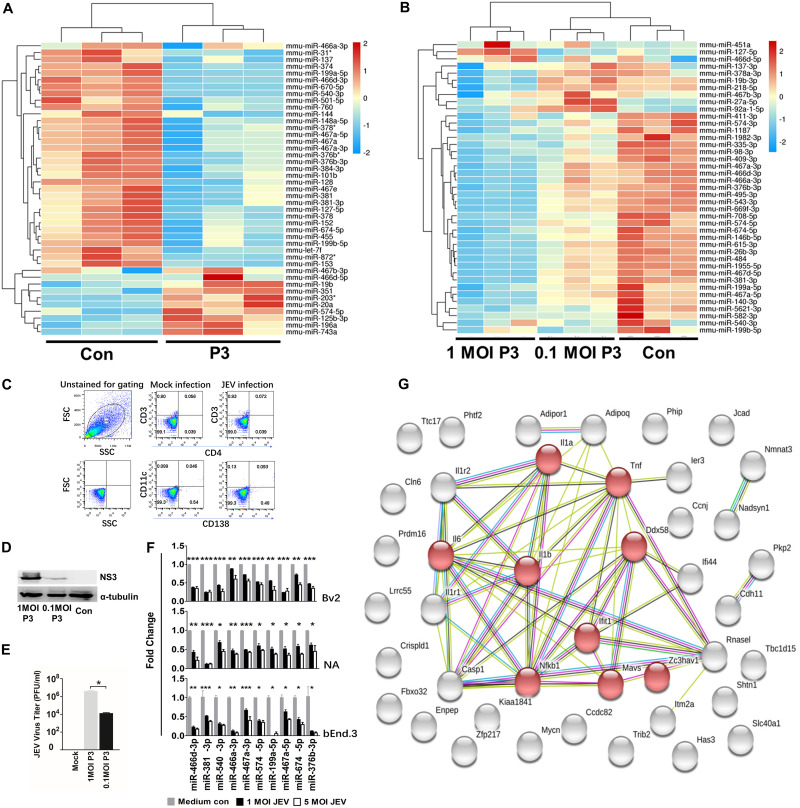
FIG 1.
JEV infection downregulates global miRNA expression in the mouse nervous system. (A) Changes in miRNA expression upon JEV infection of mouse brains. Four-week-old BALB/c mice were infected with 103 PFU of P3 or medium control (Con). After 9 days of infection, miRNA expression of JEV-infected mice was compared with that from the noninfected control. The color scale is based on log2 changes in expression. (B) Changes in miRNA expression upon JEV infection of NA cells. NA cells were infected with P3 or medium control at an MOI of 0.1 and an MOI of 0.01. After 48 h of infection, miRNA expression of JEV-infected cells was compared with that for the noninfected control. The color scale is based on log2 changes in expression. (C) Fluorescence-activated cell sorter (FACS) analysis of the cell population in mouse brains. Four-week-old mice were infected with 103 FFU of JEV or mock infected for 5 days intracerebrally. Brain cells were analyzed by FACS analysis with the indicated antibodies. FSC, forward scatter; SSC, side scatter. (D) Western blot of NA cells infected with P3 or medium control at an MOI of 1 and an MOI of 0.1 after 48 h. (E) Virus titers of NA cells infected with P3 at an MOI of 1 and an MOI of 0.1 after 48 h. (F) qRT-PCR analyses of mature miRNA levels in BV2, NA, and bEnd.3 cells after 48 h of JEV infection (at an MOI of 1 and an MOI of 5). The results are shown as means and standard deviations (SD). (G) A protein interaction network was constructed by STRING based on the candidate genes (42 genes) of common mRNA from the miRNA and mRNA expression profile. The light-blue lines indicate interactions from curated databases. The purple lines denote experimentally validated interactions. The green lines show predicted interactions from gene neighborhoods. The red lines indicate predicted interactions from gene fusions. The dark-blue lines show predicted interactions from gene cooccurrence. The yellow lines represent interactions from text mining. The light-purple lines denote interactions from protein homology. The black lines show interactions from coexpression. The network is divided into many groups according to the biological process (GO). The red nodes in the network represent the genes that had a role in the immune and inflammatory process. The average number of connections per node is 2.81 (protein-protein interaction enrichment; P < 1.015). Significance was assessed using Student's t test; *, P ≤ 0.05.

