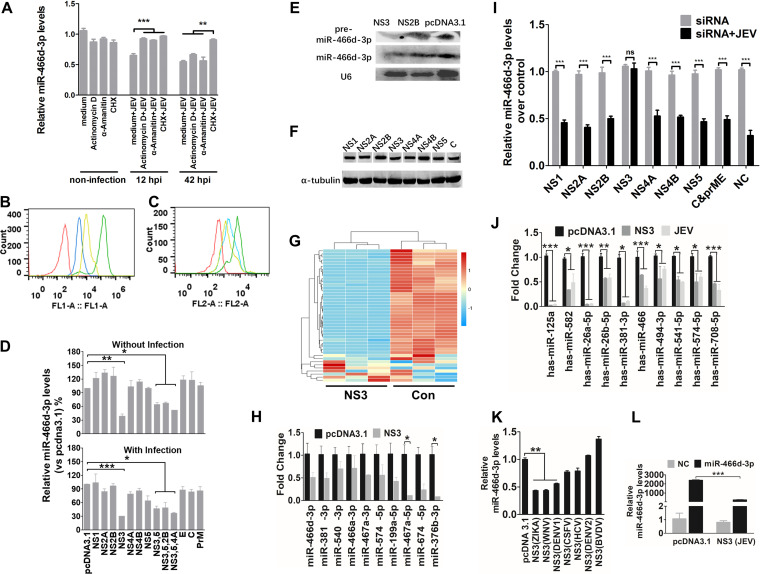
FIG 3.
NS3 of JEV mediates miR-466d degradation in neurons. (A) Transcription and translation inhibition assay. NA cells were mock treated with medium or infected with P3 at an MOI of 5, and actinomycin D (10 mΜ), α-amanitin (10 mΜ), or CHX (100 nM) was added to the NA cells at 12 hpi or 42 hpi. After 48 h of infection, total RNA from the NA cells was used to quantify the expression of miR-466d-3p. (B and C) FACS analysis of RNA and protein synthesis. (B) NA cells (106 cells/ml) were treated with vehicle or CHX (100 nM) for 30 min at 37°C. Subsequently, the cells were incubated for an additional 30 min with fresh aliquots of medium containing protein label or protein label and CHX. FACS analysis of the negative-control (red line), background (azide only; blue line), positive-control (protein label; green line), and CHX-treated (yellow line) cell populations was performed. (C) NA cells (106 cells/ml) were pretreated with vehicle, α-amanitin (10 mΜ), or actinomycin D (10 mΜ) for 4 h at 37°C. Subsequently, the cells were incubated with EZClick RNA label for 1 h. FACS analysis of negative-control (red line), positive-control (RNA label), α-amanitin-treated (blue line), and actinomycin D-treated (yellow line) cells was done according to the protocol. (D) Relative analyses of miR-466d-3p expression in NA cells transfected with the indicated expression plasmids with and without JEV infection. After 48 h of transfection/infection, the total RNA from NA cells was used to quantify relative expression of miR-466d-3p (versus pcDNA 3.1 control) by qRT-PCR. (E) Detection of miRNA by Northern blotting. Total RNA was isolated with RNAiso Plus and detected with a DIG-labeled probe. (F) Western blotting of expression of NS1, NS2A, NS2B, NS3, NS4A, NS4B, NS5, and C protein. (G) Changes in miRNA expression upon transfection of NS3 in NA cells. NA cells were transfected with NS3 or pcDNA 3.1 control (Con). After 48 h of transfection, miRNA expression of NS3-transfected cells was measured by RNA deep sequencing and compared with that for the pcDNA 3.1-transfected control. The color scale is based on log2 changes in expression. (H) qRT-PCR of levels of mature miRNA in NA cells after 48 h of transfection of NS3. (I) qRT-PCR of miR-466d-3p in NA cells after 48 h of infection with P3 at an MOI of 0.1 and transfection with the indicated siRNAs. (J) qRT-PCR of human miRNA in NA cells after 48 h of transfection with NS3 or infection with P3 at an MOI of 0.1. (K) qRT-PCR of miR-466d-3p in NA cells after 48 h of transfection with NS3 proteins of ZIKA virus, WNV, DENV-1, DENV-2, CSFV, BVDV, and HCV. (L) Quantification of degradation of exogenous miR-466d-3p mimic in NA cells by qRT-PCR. NA cells were transfected with NS3, and after 48 h, the NA cells were transfected with miR-466d-3p mimic. After 54 h of transfection of NS3, the total RNA from the NA cells was used for quantification. For all graphs, results are shown as means and SD. Significance was assessed using Student's t test. *, P ≤ 0.05; **, P ≤ 0.01; ***, P ≤ 0.001; ns, not significant (P > 0.05).

