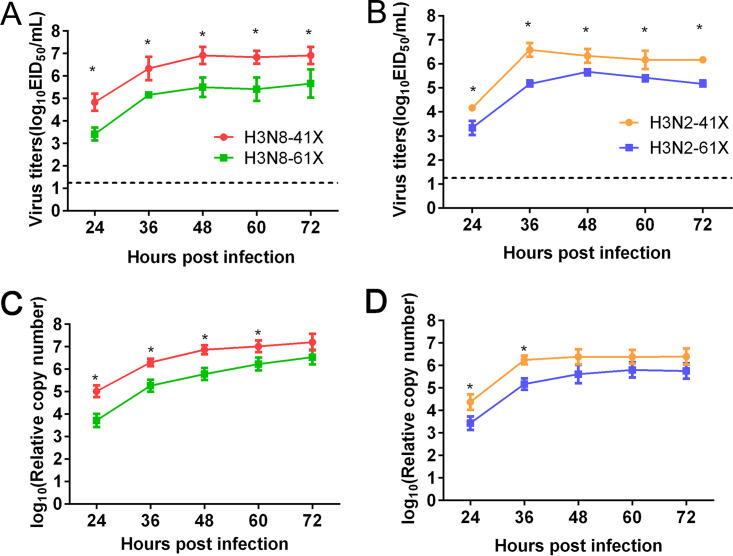
FIG 2.
Growth curves of CIVs in MDCK cells. MDCK cells were infected with H3N8-41X and H3N8-61X viruses (A and C) and H3N2-41X and H3N2-61X viruses (B and D) at an MOI of 0.1. Viral titers were assessed by EID50 assay (A and B) or real-time RT-PCR (C and D) at the indicated time points. The results are shown as the means ± standard deviations (n = 3 biological replicates and n = 3 technical replicates). *, P < 0.05.

