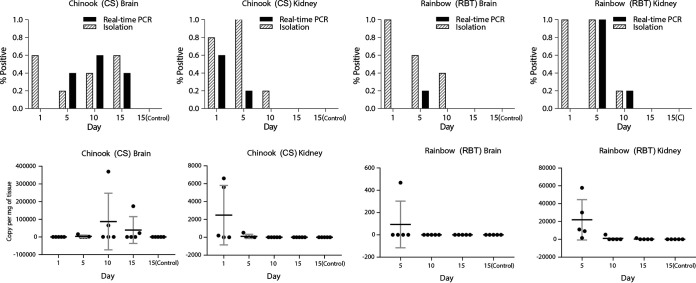
FIG 5.
Detection of salmon flavivirus in Chinook salmon (Oncorhynchus tshawytscha) (CS) and rainbow trout (Oncorhynchus mykiss) (RBT) fingerlings exposed experimentally by intracoelomic injection. Brains and kidneys of fingerlings (n, 5 per species) were collected at different time points postinoculation, and virus was detected using RT-qPCR or viral isolation. The upper panels show the frequency of detection by each method, and the lower panels show the numbers of viral genome copies by RT-qPCR. Results for control animals at day 15 [15(Control)] are also shown. In the two graphs on the lower right, viral copies for RBT on day 1 of the experiment are not shown due to RNA degradation. Note that the scales of viral copy numbers are different in all four graphs.

