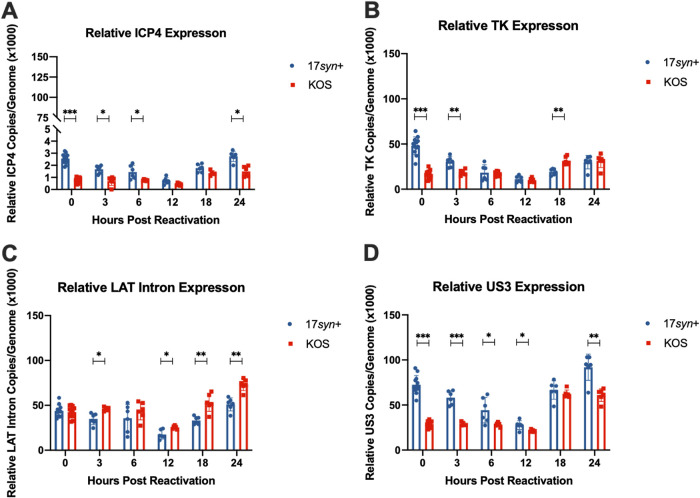
FIG 6.
Transcripts produced per genome during the latent infection and following PI3K inhibitor-induced reactivation differ between 17syn+ and KOS(M). Relative ICP4 (A), TK (B), LAT intron (C), and US3 (D) expression calculated during latency and following reactivation are expressed on a per-genome basis. Reactivation was induced at day 8 postinfection with 10 μM Ly294002, and reactivation samples were harvested at the indicated times. RT-qPCR was performed as described in Materials and Methods and Table 2. For each time point, significance was determined by ordinary two-way ANOVA with Sidak’s multiple-comparison test across 6 to 12 biological replicates (*, P < 0.05; **, P < 0.001; ***, P < 0.0001) (n = 6 to 12).

