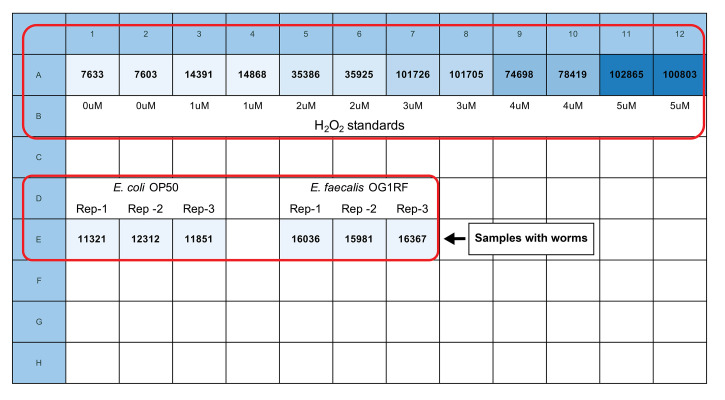
Figure 2. Sample plate organization and fluorescence readings.
Row “A” has duplicates of increasing concentrations (0-5 μM) of H2O2 for creating the standard curve. Row “E” has technical triplicates of the samples with the worms exposed to E. coli OP50 and E. faecalis OG1RF bacteria. Note that the samples are placed in the wells relatively far from the H2O2 standards. The reading was taken 60 min after mixing the samples with the Amplex Red reagent.

