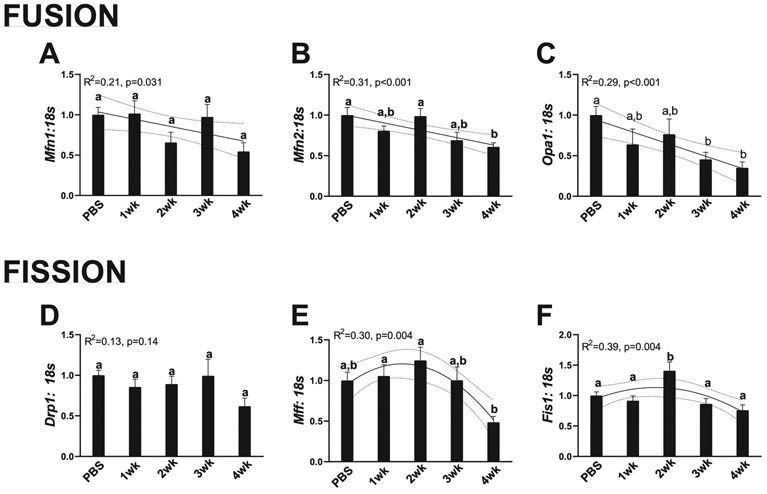
Fig. 7.
Makers for mitochondrial dynamics. (A) RNA content of Mfn1. (B) RNA content of Mfn2. (C) RNA content of Opa1. (D) RNA content of Drp1. (E) RNA content of Mff.(F) RNA content of Fis1. All graphs are means ± SEM, n = 7–10/group for each analysis. Significant trends are plotted against means with 95% confidence intervals. 1wk, 2wk, 3wk, 4wk, 1, 2, 3, and 4 weeks of cancer progression, respectively; PBS, phosphate-buffered saline.

