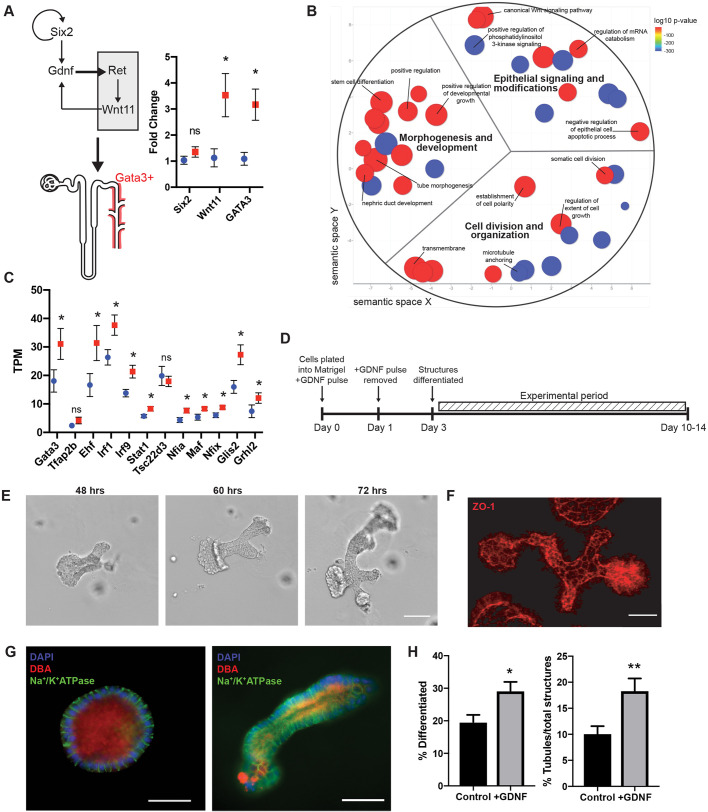
Fig. 3.
Effect of GDNF on organoid differentiation. (A) Schematic of the GDNF–Ret signaling axis that drives formation of the collecting duct system. Relative mRNA fold change between control (n=4 cultures for each group, blue circle) and GDNF pulse (n=4 cultures for each group, red square) organoids for the stem cell marker, Six2 (P=0.2854, two-tailed Student's t-test), and the downstream GDNF effectors Wnt11 and Gata3 (Wnt 11, P=0.0367; Gata3, P=0.0184; two-tailed Student's t-test). Data shown are mean±s.e.m. (B) ReviGO representation of significantly changed (nominal P<0.05) GO terms in GDNF pulsed organoids [n=4 cultures, dot size=log10 frequency (percentage of genes annotated) with that GO term (Supek et al., 2011), dot color=log10 P-value]. (C) Principal cell-specific transcription factors are significantly upregulated in GDNF pulsed tubuloids (n=4 cultures for each group, red square) when compared to controls (n=4 cultures for each group, blue circle). Significant upregulation of Gata3 (P=0.0499), Ehf (P=0.0455), Irf1(P=0.0225), Irf9 (P=0.0132), Stat1 (P=0.0220), Nfia (P=0.0168), Maf (P=0.0239), Nfix (P=0.0171), Glis2 (P=0.0175), and Grhl2 (P=0.0789) determined by one-tailed Student's t-test. Data shown are mean±s.e.m. (D) Schematic experimental paradigm for the GDNF pulse. (E) Morphometry tracking of tubuloids. Representative bright-field images of tracked tubule bifurcation events from 48 h to 72 h post-plating. Scale bar: 100 μm. (F) 3D SIM reconstruction of ZO-1 (red) to demonstrate junctional organization in tubuloid structures. Scale bars: 25 μm. (G) Immunofluorescence images of a differentiated spheroid and tubule positive for collecting duct marker, DBA (red) with basolateral Na+/K+-ATPase (green) and DAPI (blue). Scale bars: 50 μm. (H) Quantification of structure classification in bright-field images taken with 4× objective magnification reveals that the addition of GDNF yields more differentiated structures (P=0.0102; two-tailed Student's t-test) that are tubules (P=0.0091; two-tailed Student's t-test.) when compared to control. Data shown are mean±s.e.m. n=574 structures, three tubuloid preparations and three mice for control and n=526 structures, three tubuloid preparations and three mice for +GDNF. **P≤0.01; *P≤0.05; ns, not significant.

