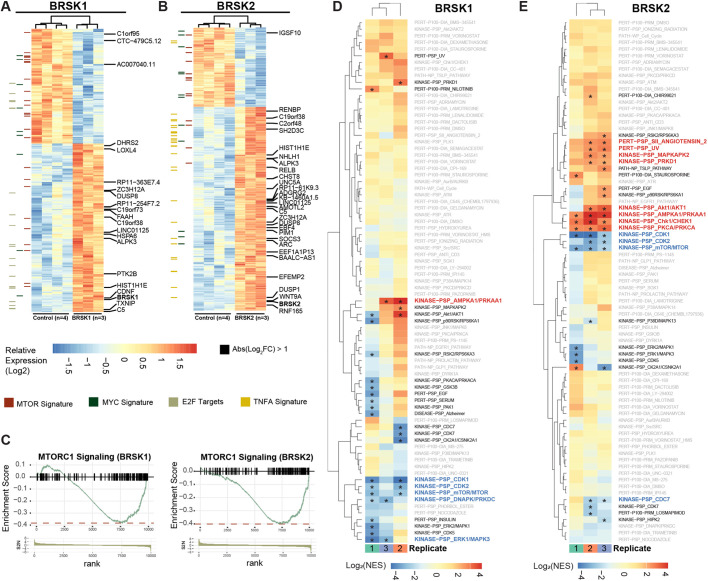
Fig. 5.
RNAseq and phosphoproteomics reveal activation of AMPK and suppression of MTOR following expression of BRSK1 or BRSK2. (A,B) Hierarchical clustering of RNA sequencing analysis of HEK293 T mock-transfected cells and cells transfected with hcRED control, BRSK2 or BRSK1 for 24 h. (C) Differentially expressed genes with FDR<5% were analyzed by GSEA using the Hallmark and Oncogenic gene sets from MSigDB. Enrichment score plots representing genes commonly associated with MTORC1 signaling were decreased by BRSK2 or BRSK1 overexpression based on GSEA. (D,E) Quantitative TMT phosphoproteomic analysis of HEK293T cells expressing hcRED, BRSK1 or BRKS2 for 24 h. TMT ratios from biological triplicate samples were analyzed for enrichment of phosphosites associated with known signaling pathways using the PTMSigDB pipeline (*FDR<10%).

