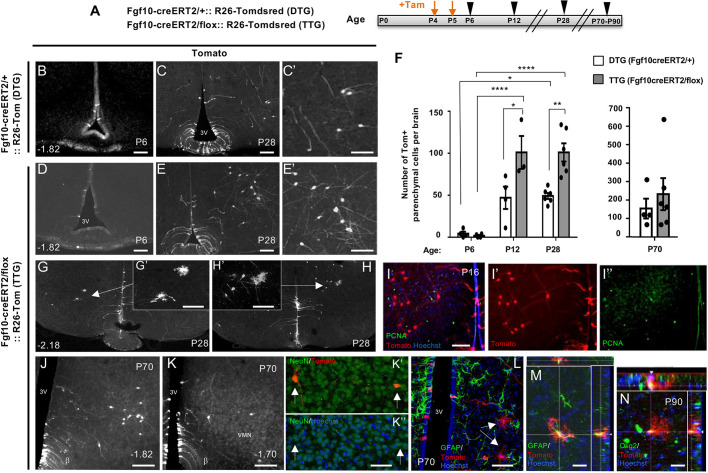
Fig. 2.
Overproduction of hypothalamic neural cells upon Fgf10 deletion from β-tanycytes. (A) Experimental paradigm for simultaneous deletion of Fgf10 and lineage tracing of recombined cells in TTG and DTG mice by tamoxifen treatment at P4/P5 (orange arrows) and subsequent analysis at P6, P12, P28 and P70-P90 (black arrowheads). (B-E′), Representative coronal images of comparable bregma co-ordinates from tamoxifen-treated DTG and TTG brains. (F) Quantifications show a significantly greater abundance of parenchymal Tom+ cells in TTG at P28, with maintenance of parenchymal cells as late as P70. (G-H′), Examples of glial-like Tom+ cells found in TTG brains at P28, (I-I″) Paucity of PCNA expression by lineage-traced parenchymal cells in TTG at P16. (J-N) Persistence of lineage traced cells at P70 (J-L) and P90 (M,N). (J-K″) Examples of neuron-like cells with some verified by NeuN co-expression, as indicated by arrows in K′,K″. (L-N) Examples of glial-like cells (arrows in L), with some expressing GFAP (M) or Olig2 (N) as evident in cut views (insets). DTG: P6 (n=4), P12 (n=4), P28 (n=6), P70 (n=4); TTG: P6 (n=4), P12 (n=3), P28 (n=6), P70 (n=6), P90 (n=1). Data are mean±s.e.m. *P<0.05, **P<0.01, ****P<0.0001 (F, left graph, two-way ANOVA followed by Tukey's test; F, right graph, Student's unpaired two-tailed t-test). Numbers at the bottom left of each panel indicate bregma coordinates. Scale bars: 100 µm in B-E′,I-K; 50 µm in G′,H′,K″,L; 25 µm in M,N.

