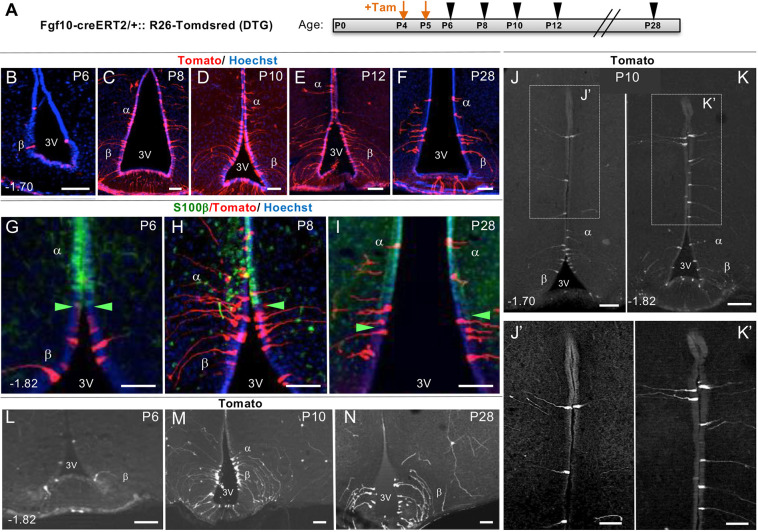
Fig. 3.
Trans-compartmental progression of lineage-traced Tomato+ cells from β- to α-tanycyte cell domain. (A) Experimental paradigm for close scrutiny of Tom+ β-tanycytes and their descendants, labelled at P4/P5 by tamoxifen treatment and traced in cohorts at two-day intervals between P6 and P12, and at P28. (B-F) Low power coronal images showing the overall amplification of Tom+ cells within the ependymal wall. (G-K′) Higher power images showing temporal progression of Tom+ cells across the S100β boundary (green arrowheads; Goodman and Hajihosseini, 2015) (G-I), into and well beyond the classic α-tanycyte domain (J-K′). (L-N) Low power examples of Tom+ parenchymal cells generated by P4/P5 lineage-traced β-tanycytes. Note the scarcity of these cells at P6. Numbers at the bottom left of each panel indicate bregma coordinates. α, α-tanycyte; β, β-tanycyte; 3V, third ventricle. Scale bars: 50 µm in B-I,J′,K′; 100 µm in J,K,L-N.

