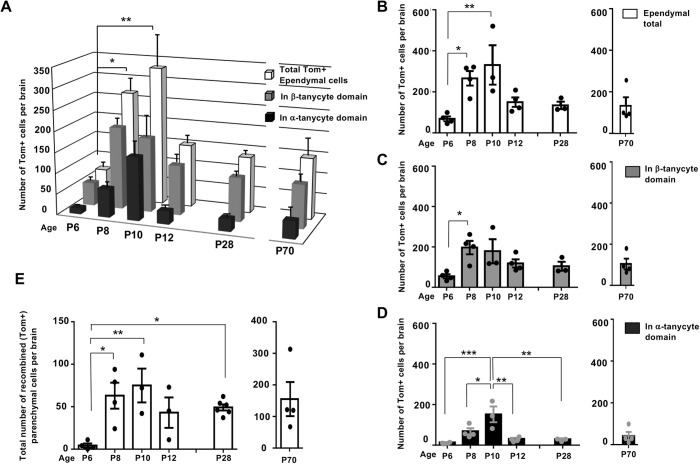
Fig. 4.
Differential amplification and retention of lineage-traced β-tanycytes and their progeny, within the ependymal and parenchymal cell compartments. (A-E) Graphs show the number and spatial distribution of Tom+ cells per hypothalamus in the ependymal (A-D) and parenchymal (E) compartments of DTG pups, pulsed acutely with tamoxifen at P4/P5 and analyzed at the indicated ages. (A) The overall pattern of emergence and decline, split into individual graphs with individual data points for total ependymal cells (B), and cells found in β-tanycyte (C) and α-tanycyte (D) cell domains. Note the lag in the emergence of Tom+ α-tanycytes at P8, their peak at P10, and their subsequent decline in the ependymal compartment by P12 (A,C,D) and maintenance at this level into adulthood (A). (E) Emergence and peak of parenchymal Tom+ cells mirroring that of α-tanycytes between P8 and P10, with a significant retention by P28. Ependyma: all ages n=4 except P10, P28 n=3. Parenchyma: P6 n=4, P8 n=4, P10 n=3, P12 n=3, P28, n=6, P70 n=4. Data are mean±s.e.m. *P<0.05, **P<0.01, ***P<0.001 (one-way ANOVA followed by Tukey's test).

