
Figure 3.
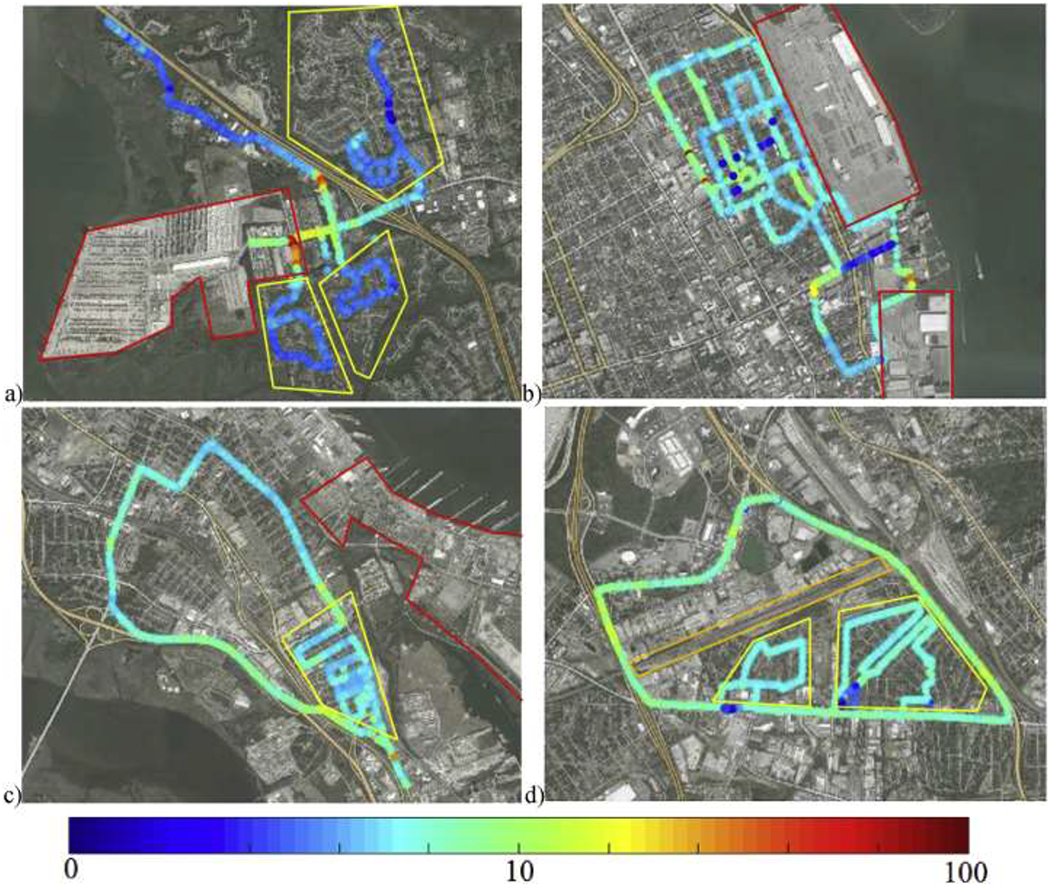
Measured PM2.5 concentrations (μg/m3) along driving routes at a) Wando Welch terminal, b) Columbus Stree/Union Pier terminals, c) Vertan’s Terminal, and d) Bennett Rail Yard. Port areas outlined in red, rail yard outlined in orange, neighborhood regions outlined in yellow.