
Figure 4.
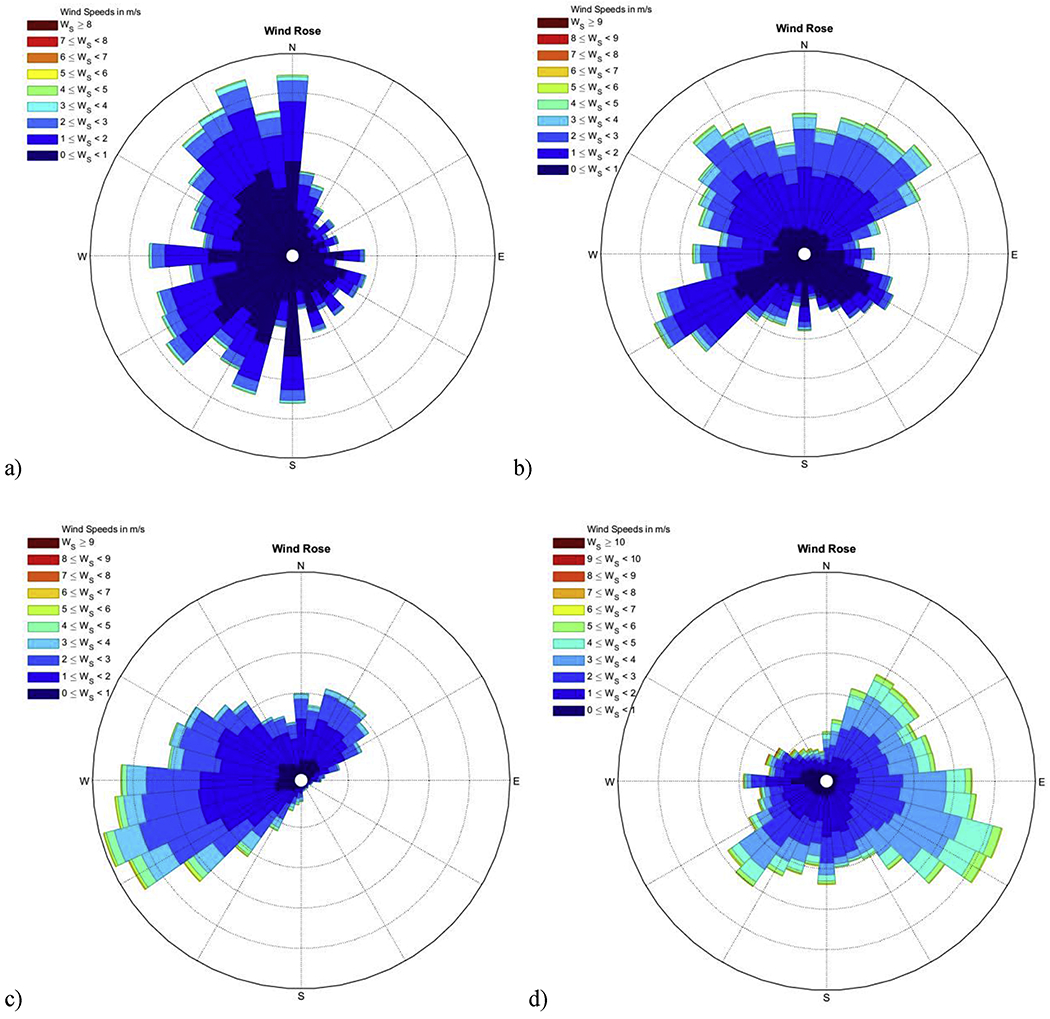
Wind rose plots showing wind speed and direction during entire measurement campaign at a) Wando Welch terminal, b) Columbus Stree/Union Pier terminals, c) Vertan’s Terminal, and d) Bennett Rail Yard.
Official websites use .gov
A
.gov website belongs to an official
government organization in the United States.
Secure .gov websites use HTTPS
A lock (
) or https:// means you've safely
connected to the .gov website. Share sensitive
information only on official, secure websites.
Wind rose plots showing wind speed and direction during entire measurement campaign at a) Wando Welch terminal, b) Columbus Stree/Union Pier terminals, c) Vertan’s Terminal, and d) Bennett Rail Yard.