
Figure 5.
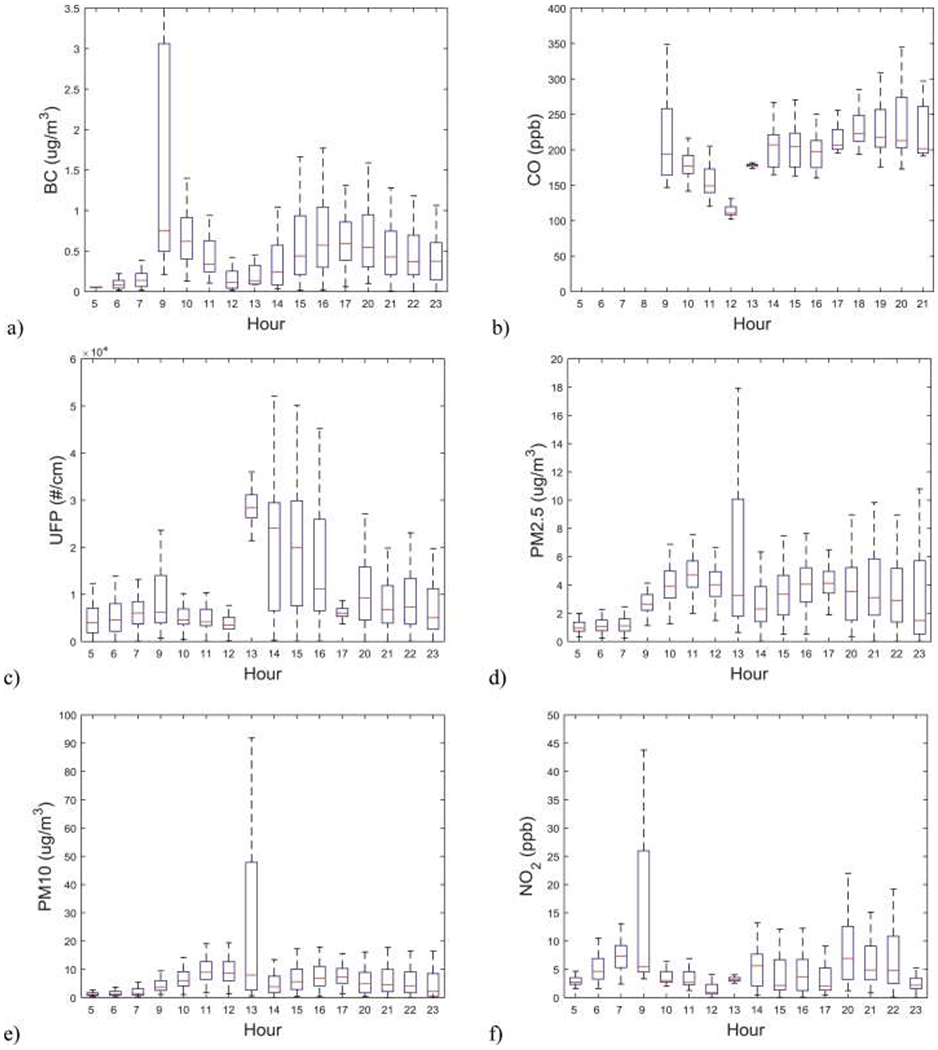
Concentration distributions at Wando Welch terminal of measured a) BC, b) CO, c) UFP d) PM2.5, e) PM10, and f) NO2. Major distribution lines show 5, 25, 50, 75, and 95 percentiles.
Official websites use .gov
A
.gov website belongs to an official
government organization in the United States.
Secure .gov websites use HTTPS
A lock (
) or https:// means you've safely
connected to the .gov website. Share sensitive
information only on official, secure websites.
Concentration distributions at Wando Welch terminal of measured a) BC, b) CO, c) UFP d) PM2.5, e) PM10, and f) NO2. Major distribution lines show 5, 25, 50, 75, and 95 percentiles.