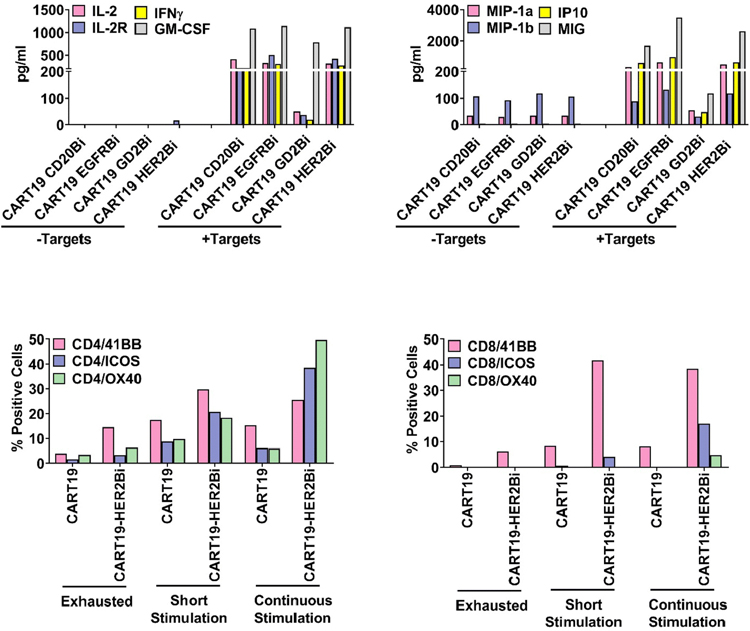
Figure 5.
Top panel shows the cytokine/chemokine profiles of culture supernatant of HER2Bi-, EGFRBi-, GD2Bi-, CD20Bi-armed CART19 cells cultured with or without their corresponding tumor targets. Data suggest dominant Th1 cytokine (Upper left panel) and chemokine profile (Upper right panel). Lower panels shows activating co-receptors expression on CD4 (Left) and CD8 T cell population (Right) of exhausted (lack of cytotoxicity), short- (24h) or long-term (2 weeks) antigen-exposed unarmed or armed CART19. Data are presented as percentage positive cells within each subset.

