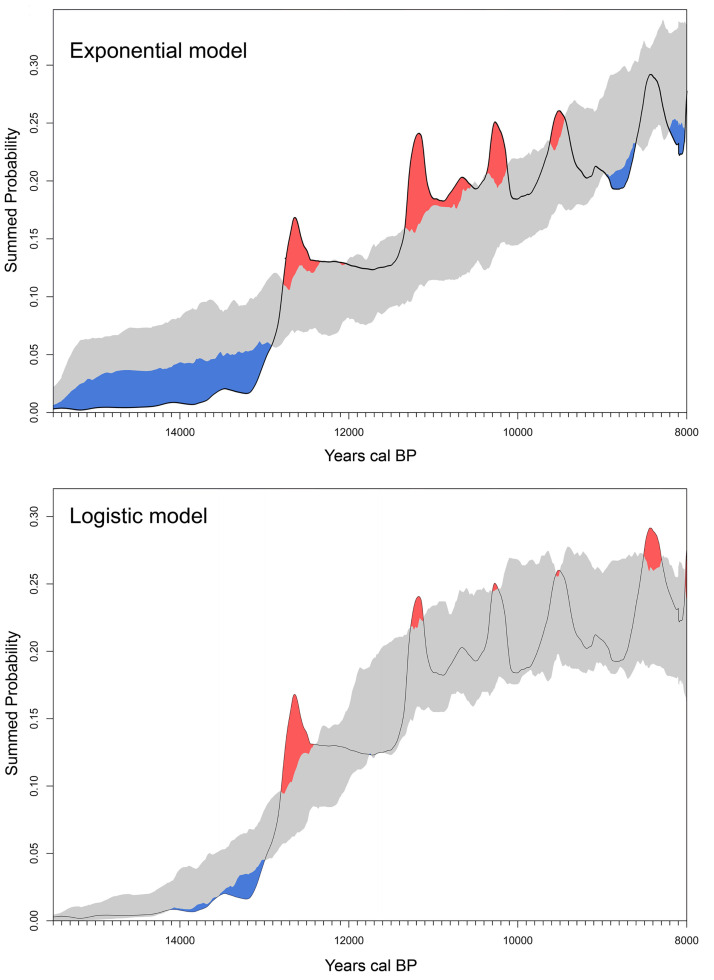
Fig 3. Summed probability distributions and Model Fit for all Radiocarbon dates.
14C Dates (black line), with fitted null model and its 95% confidence interval (grey-shaded area) for an exponential fit (top) and logistic fit (bottom). Red-shaded areas indicate regions that are above the expectation model’s confidence interval, whereas blue shading indicates regions below. Figure generated with rcarbon package of R [39].

