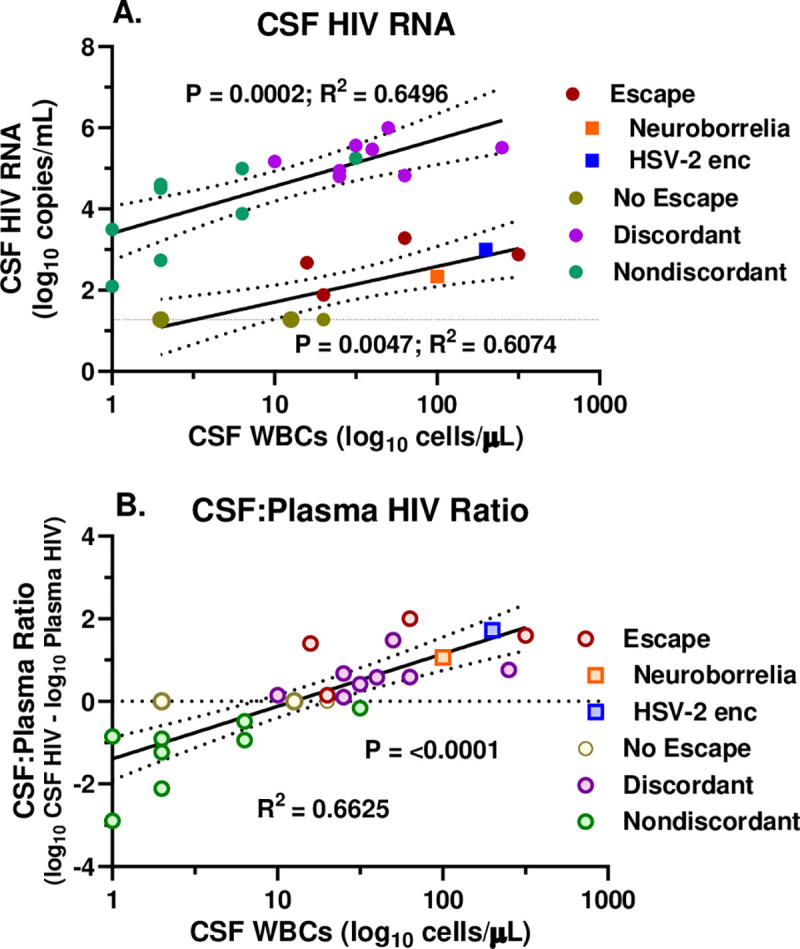
Fig 3. Relation of CSF HIV-1 RNA and CSF:plasma HIV- RNA ratio to CSF WBC counts.

A. Linear regressions plotting the relation of the log10 CSF HIV-1 RNA concentrations per mL to the log10 CSF WBC counts per μL in the treated (lower line) and untreated (upper line) subjects. Symbol colors are as in Fig 1 as per legend. The larger symbols for the no escape subjects indicate two points with overlapping values. B. Linear regression plotting the relation of the CSF:plasma HIV-1 RNA ratio (calculated as log10 difference between CSF and plasma HIV-1 RNA values) to the log10 CSF WBC counts per μL. The horizontal dotted line indicates equivalent values in CSF and plasma. Open symbols are the same colors as in Fig 1. Statistics shown are the P and R squared values from the linear regressions which are plotted with 95% confidence intervals.
