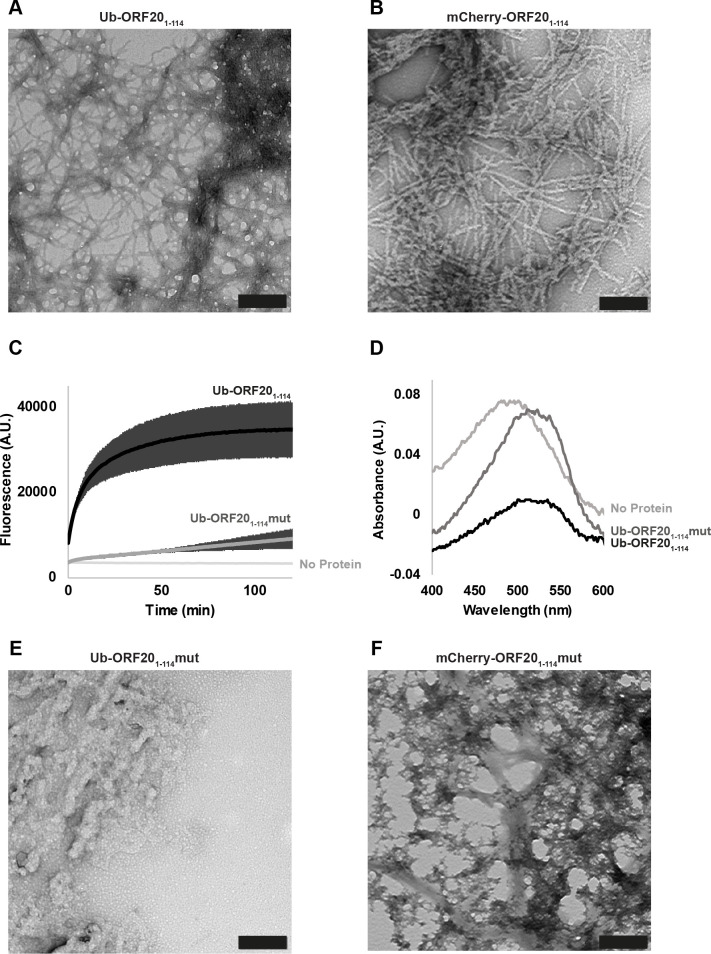
Fig 7. The ORF20 RHIM forms homomeric amyloid structures.
(A) Transmission electron microscopy image of structures formed by Ub-ORF201-114. Scale bar represents 200 nm. (B) Transmission electron microscopy image of structures formed by mCherry-ORF201-114. Scale bar represents 200 nm. (C) ThT fluorescence over time of Ub-ORF20 constructs after dilution from 8 M urea into assembly buffer. Buffer sample contains equimolar ThT but no protein. Curves are derived from three independent replicates. Error bars indicate standard deviation. (D) Absorbance spectra of solutions containing Congo red and Ub-ORF201-114 and Ub-ORF201-114mut after dialysis against assembly buffer. Buffer refers to a Congo red sample in assembly buffer with no protein. (E) Transmission electron microscopy image of structures formed by Ub-ORF201-114mut. Scale bar represents 200 nm. (F) Transmission electron microscopy image of structures formed by mCherry-ORF201-114mut. Scale bar represents 200 nm.

