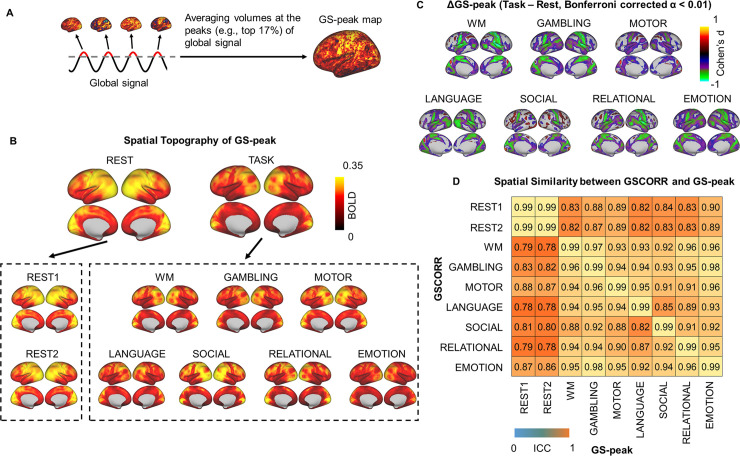
Fig 3. Instantaneous activation topography at the peak of GS.
(A) An illustration of calculating the coactivation pattern at the peak (top 17%) of the GS (“GS-peak”). (B) Spatial patterns of GS-peak in the 2 days’ resting states and the seven tasks. Top panel yielded the averaged spatial patterns for rest and task, respectively. Bottom panel yielded the spatial pattern in each condition. (C) Grayordinate-based group comparisons for GS-peak. The spatial maps were tested with paired t tests, thresholded at Bonferroni-corrected α < 0.01, and illustrated by Cohen’s d to account for the effect size. (D) ROI-based spatial similarity between GSCORR and GS-peak. Data are available at Dryad: https://doi.org/10.5061/dryad.xsj3tx9bw. BOLD, blood oxygen level–dependent; GS, global signal; GSCORR, GS correlation; ROI, region of interest; WM, working memory.

