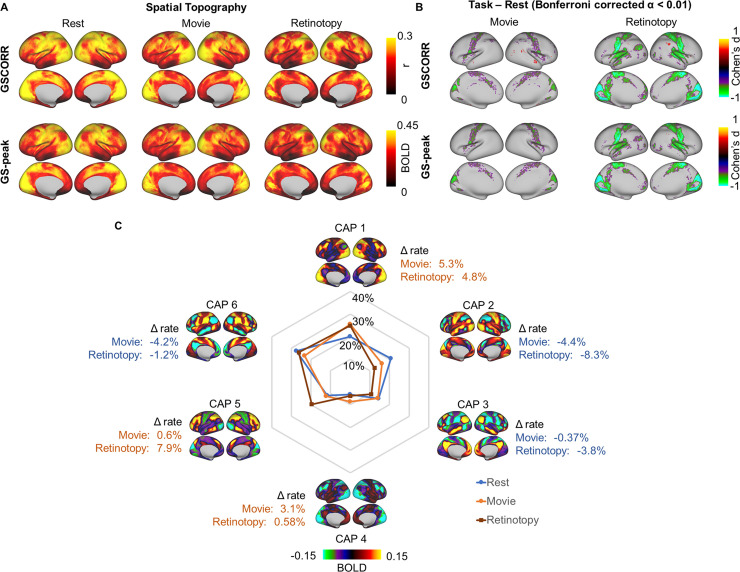
Fig 8. Reproducibility of the GS topography and its task modulation in HCP 7T dataset.
(A) Spatial topography measured by GSCORR and GS-peak in resting state and two additional tasks (e.g., movie watching and retinotopy stimuli watching). (B) Grayordinate-based group comparison for GS topography. The maps were tested with paired t test between each task and rest. The maps were thresholded at Bonferroni-corrected α < 0.01 and illustrated by Cohen’s d. (C) Occurrence rates of CAPs and the difference between tasks and resting state. Data are available at Dryad: https://doi.org/10.5061/dryad.xsj3tx9bw. BOLD, blood oxygen level–dependent; CAP, coactivation pattern; GS, global signal; GSCORR, GS correlation; HCP, Human Connectome Project; T, tesla; WM, working memory.

