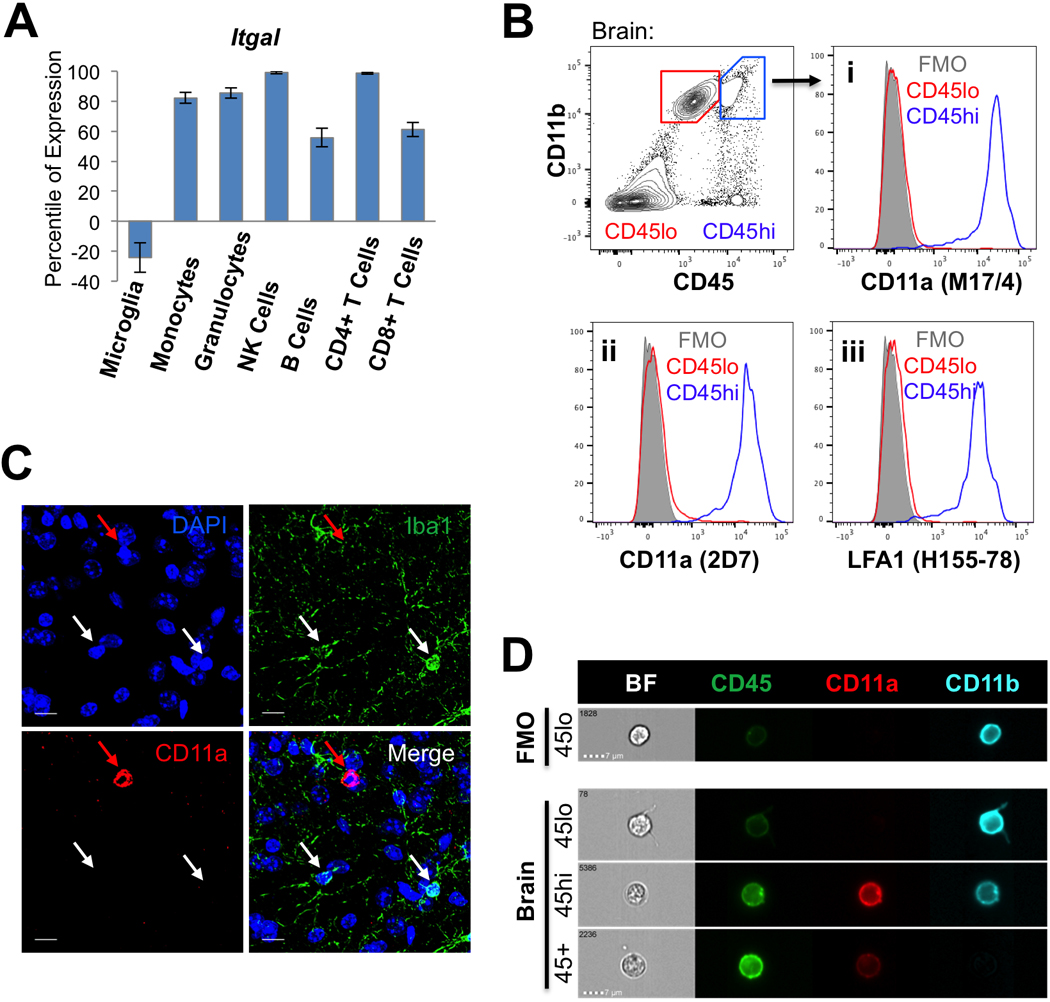
Figure 1: CD11a is not expressed in steady-state microglia.

(A)Gene expression profile of Itgal (CD11a) in microglia and peripheral hematopoietic cells. Percentile of expression is based on comparison to a reference panel of nearly 12,000 microarrays (www.gexc.riken.jp). Values below zero are considered unexpressed. (B) Flow cytometry plots of adult mouse brain cells. CD11b+ CD45lo microglia (“CD45lo”, red gate) and CD11b+ CD45hi macrophages (“CD45hi”, blue gate) were analyzed for cell surface expression of CD11a using antibody clones M17/4 (i), 2D7 (ii) against CD11a, and H155–78 (iii) against LFA-1 (CD11a/CD18). Histograms show CD45lo microglia (red), CD45hi macrophages (blue), and fluorescence minus one control (“FMO”, grey). (C) Immunofluorescence image of C57/B6 brain. White arrows denote representative microglia which are Iba1+ but CD11a-. The red arrow denotes an example of a CD11a+ immune cell, which is Iba1-. Images were taken at 120X, scale bars = 10μm. (D) Imaging flow cytometry of brain cells. Representative images of cells within CD11b+ CD45lo microglia (“45lo”), CD11b+ CD45hi macrophages (“45hi”) and CD11b- CD45+ lymphocytes (45+) populations in each channel (see Figure S1C for splenocyte controls). Exact same voltage correction settings were applied to all samples.
