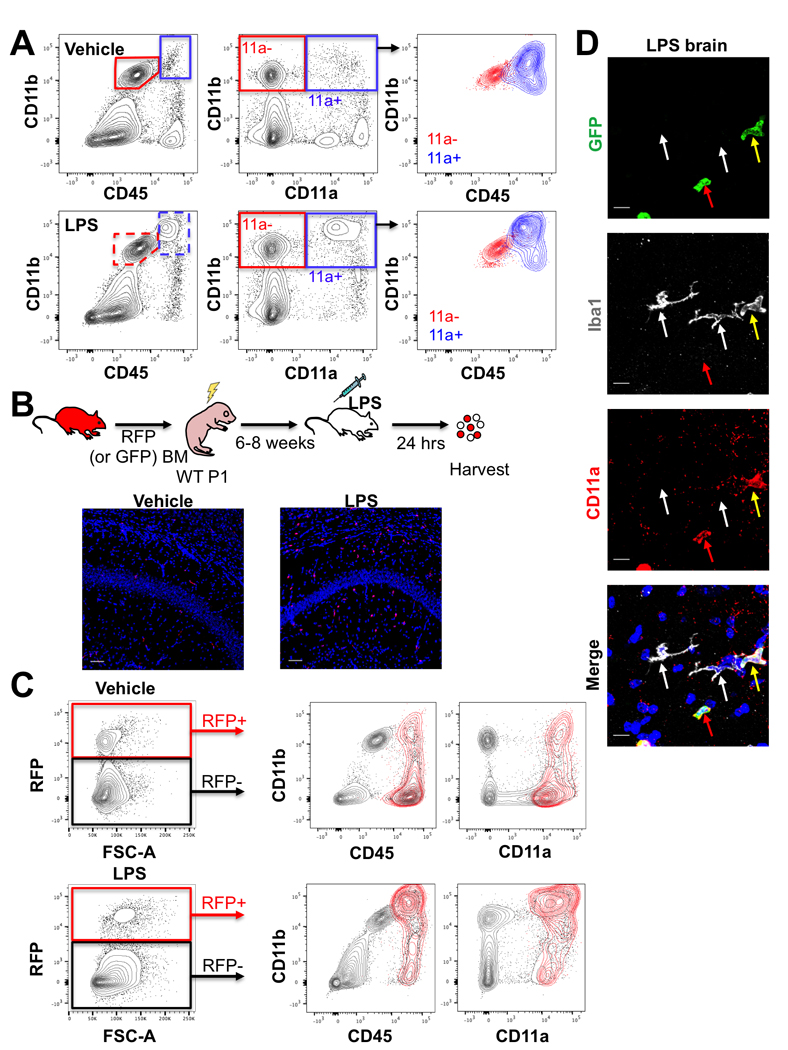
Figure 2: CD11a expression remains consistent in activated microglia and infiltrating macrophages.

(A) FACS plots of the brains of C57/B6 adult mice 24 hours after intracranial injection of vehicle (top row) or 10 μg of LPS (bottom row). Leftmost plots show traditional CD11b vs CD45 gating scheme with microglia (CD11b+ CD45lo, red gates) and macrophages (CD11b+ CD45hi, blue gates). Middle plots show CD11b versus CD11a and revised gating for microglia (CD11b+ CD11a-, “11a-”, red gate) and macrophages (CD11b+ CD11a+, “11a+”, blue gate). Rightmost plots show overlays of CD11a- (red) and CD11a+ (blue) populations (from the middle plots) on CD11b vs. CD45 plots. (B) Schematic of transplantation of adult RFP+ bone marrow into P1 C57/B6 (WT) pups, followed by intracranial LPS (or vehicle) injection 6–8 weeks after transplant, and analysis 24 hours post-injection. 20X images of one brain lobe following vehicle (left) or LPS (right) injection showing RFP+ (red) BM-derived cells in the brain versus DAPI-stained nuclei (blue). Scale bars = 50μm. (C) Flow cytometry analysis of the other brain lobe 24 hours after vehicle (top row) or LPS (bottom row) injection. The leftmost plots show gating on RFP+ BM-derived donor cells versus RFP- host cells. The middle and right plots show CD11b versus CD45 (middle plots) or versus CD11a (right plots). RFP+ cells are shown in red and host cells in grey. (D) Representative immunofluorescence images of brain sections from LPS-treated mice after transplantation of adult GFP+ bone marrow cells into neonatal recipients (120X, scale bars = 10μm). All GFP+ infiltrating cells (green) co-stain with CD11a (red). White arrows denote Iba1+ microglia, which do not express CD11a or GFP. Red arrows indicate GFP+ cells that are CD11a+ Iba1-. Yellow arrows indicate GFP+ cells that express Iba1 as well as CD11a.
