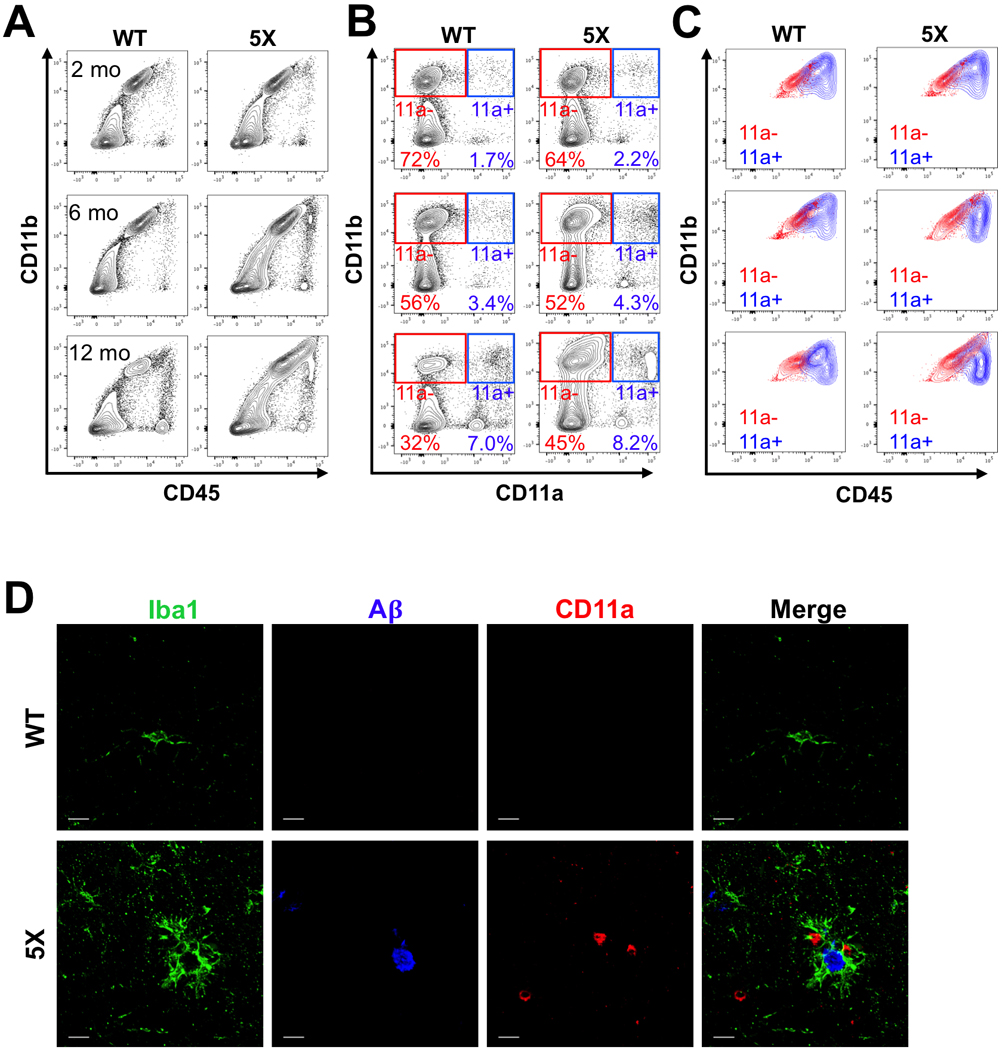
Figure 3: Microglia in 5xFAD mice do not express CD11a.

(A-C) Representative FACS plots of 5xFAD−/− (WT, left columns) and 5xFAD+/− (5X, right columns) littermates at 2 months (top row), 6 months (middle row), and 12 months (bottom row) of age. (A) Traditional CD11b versus CD45 plots show increasing overlap between microglia and macrophages in 5X mice with age. (B) CD11b versus CD11a plots show a clear distinction between microglia (CD11b+ CD11a-, “11a-”, red gate) and macrophages (CD11b+ CD11a+, “11a+”, blue gate). (C) Traditional CD11b versus CD45 plot showing an overlay of microglia (“11a-”, red) and macrophage (“11a+”, blue) populations using the CD11a gating strategy from B. (D) Representative immunofluorescent images (120X, scale bar = 10μm) of 12-month-old WT (top) and 5X (bottom) brains. Iba1+ cells (green) surrounding beta amyloid plaques (A𝛃, blue) are CD11a-. Extremely rare instances of CD11a+ cells (red) found near plaques do not express Iba1.
